- Overbought and Oversold conditions in trading is when the value of an asset has go so far up or down that it is likely to be overvalued or undervalued, respectively. When this happens, the asset’s value is expected to reverse to its fair value.
- When an asset is oversold, a bullish reversal is expected. And when an asset is overbought, a bearish reversal is expected.
- Overbought and oversold conditions in trading are easy to trade, only if you know when to open your trade.
If there’s anything constant on any chart, it’s the zig-zag nature as bulls and bears justle for control. And sometimes, the bulls or bears take it too far. We refer to these conditions as overbought and oversold.
In the rest of this piece, we’ll show you what it truly means for an asset to be overbought or oversold. We’ll also show you how to identify these conditions and trade them. If you stick around long enough, we’ll help you avoid overbought and oversold trading mistakes that others who have rushed off this post will likely make.
 Table of Contents
- What Do Overbought and Oversold Mean?
- Key Indicators for Identifying Overbought and Oversold Conditions
- How to Trade Overbought and Oversold Conditions
- Trading Overbought and Oversold Free PDF Download
- Common Mistakes to Avoid when Trading Overbought or Oversold Conditions
- Final Word
- Frequently Asked Questions
What Do Overbought and Oversold Mean?
Overbought refers to when the price of an asset in the financial market rises too fast, becoming overvalued. This can lead to a potential reversal to the downside.
Oversold refers to when the price has fallen too quickly and become undervalued. This can lead to a potential reversal to the upside.
One way to explain the reasoning behind this concept is through supply and demand. When the bullish pressure on an asset rises to the point that there’s nothing left to buy, the market is said to be overbought. That’s when traders start selling off, and the bears flood in. Similarly, when there’s so much bearish pressure on the same asset that there’s nothing left to sell, the asset becomes oversold. Everyone begins to buy again, and the bulls wade in here, too.
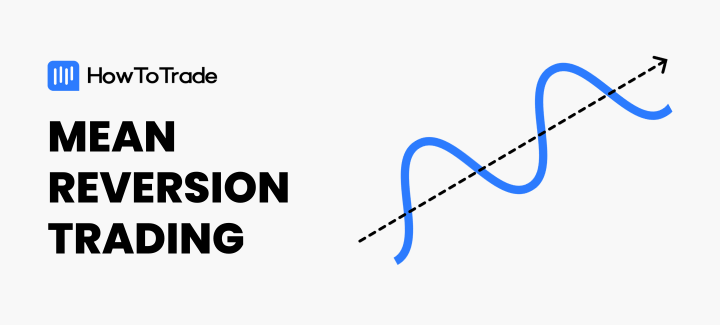
Another way to explain this concept is based on the idea that stocks tend to trade at their mean values. So, if they rise or fall too fast, they eventually reverse to trade at their mean value. So, an asset that’s risen so fast and becomes too expensive is said to be overbought. At this point, no buyers are willing to buy the asset, leaving the bears to bring the price to its fair value. Conversely, the asset becomes oversold when the price falls too quickly and becomes so cheap that sellers are no longer confident of shorting it further. And the buyers take it from there to the fair value.
Theoretically, those are potential ways to explain the concept of overbought and oversold in trading. However, what you simply need to know to trade overbought and oversold is this:
When an asset becomes overbought, its price is likely to drop soon. However, when an asset becomes oversold, its price is expected to rise soon.
Key Indicators for Identifying Overbought and Oversold Conditions
Any oscillating indicator can be used to identify overbought or oversold conditions. It gets even better if the oscillator is bounded, so its value can’t exceed a specific range. Good examples are the Relative Strength Index and the Stochastic indicators.
Let’s take a closer look at these indicators and more.
1. Relative Strength Index
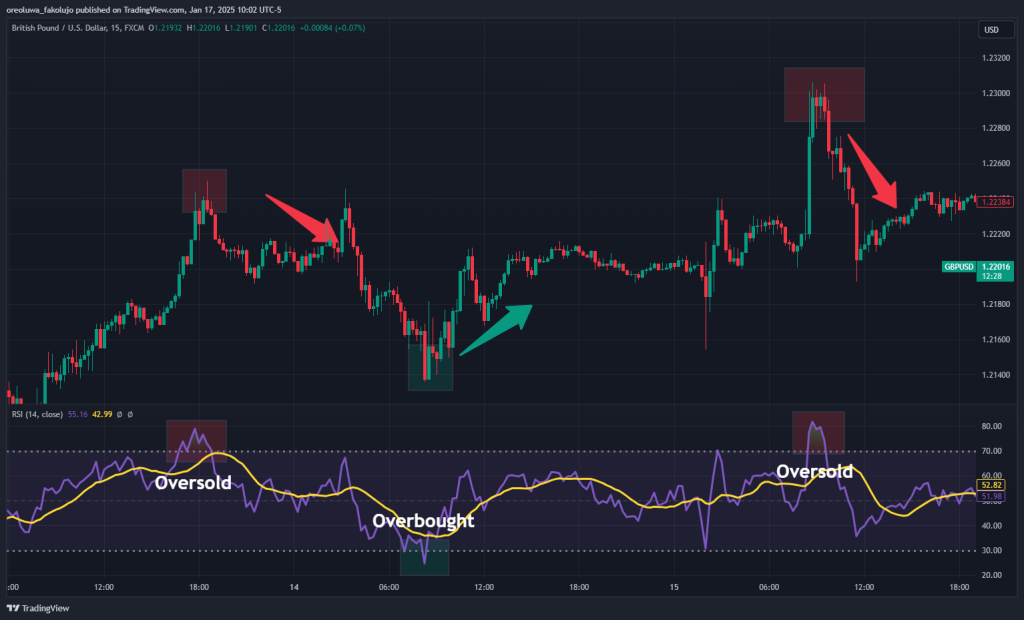
The RSI is a momentum oscillator that measures the magnitude of recent price changes to evaluate overbought or oversold conditions. It oscillates between 0 and 100. A reading above 70 traditionally suggests overbought conditions, while a reading below 30 indicates oversold conditions. You can also look for divergences between the RSI and price action, as these signal potential reversals, too.
2. Stochastic Indicator
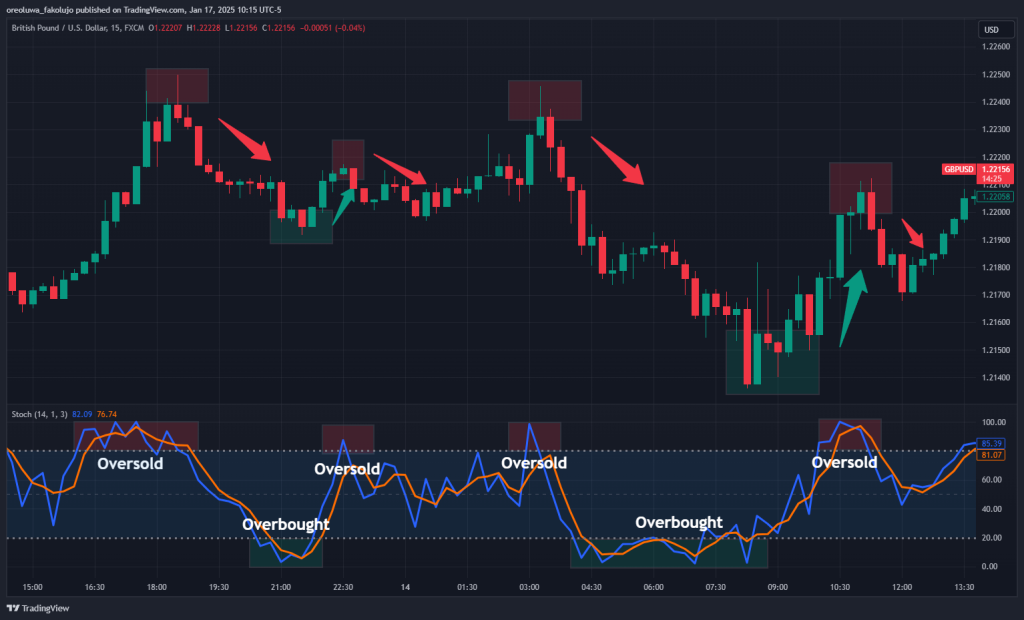
The Stochastic Oscillator compares a stock’s closing price to its price range over a specified period. It also oscillates between 0 and 100. Readings above 80 typically indicate overbought conditions, while readings below 20 suggest oversold conditions.
3. Commodity Channel Index
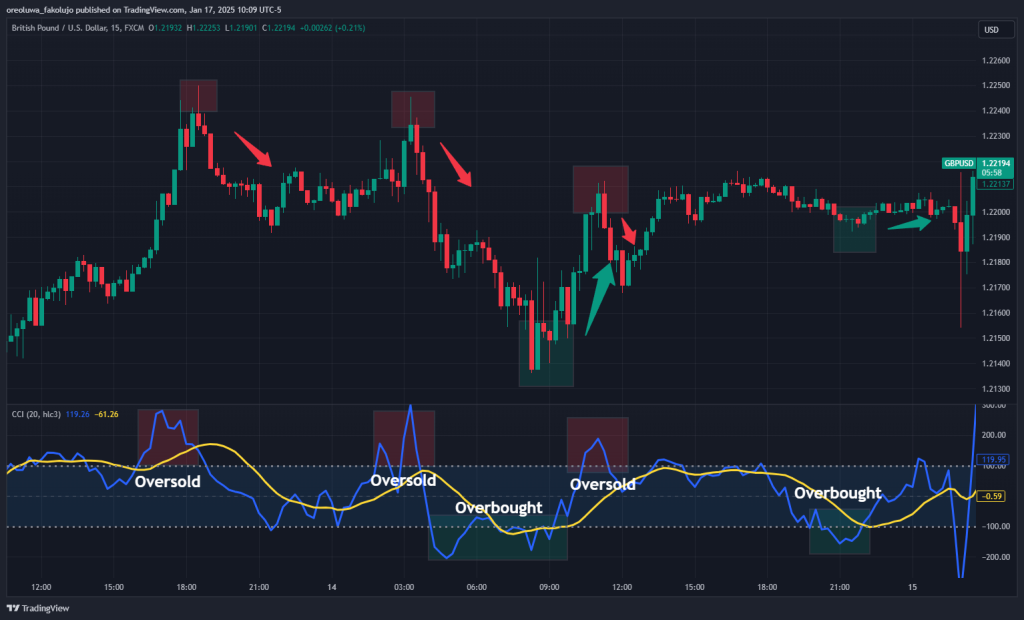
The CCI measures the difference between a stock’s current and historical average prices. High positive readings (typically above +100) indicate overbought conditions, while low negative readings (typically below -100) indicate oversold conditions.
4. Bollinger Bands
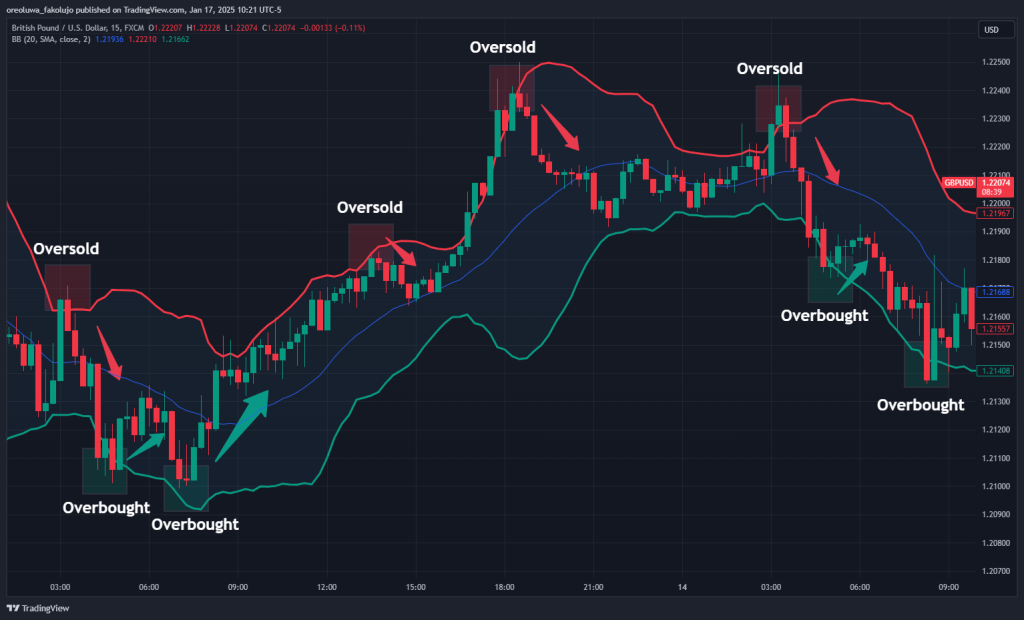
Bollinger Bands consist of a middle band and an upper and lower band. The bands are plotted around a moving average and expand or contract based on volatility. When the price touches the upper band, it may be considered overbought; when it touches the lower band, it may be considered oversold.
How to Trade Overbought and Oversold Conditions
Let’s show you an example of how to trade overbought and oversold conditions. In this example, we’ll use the RSI indicator to identify the conditions. We’ll be doing this example on GBPUSD on the 15-minute chart.
The default RSI indicator on TradingView comes with the 14-period Simple Moving Average, which we’ll use. If yours doesn’t have this moving average, you can simply add it manually.
Trade Entry
The trade entry rule is simple: Look to buy when the asset is oversold and look to sell when it is overbought.
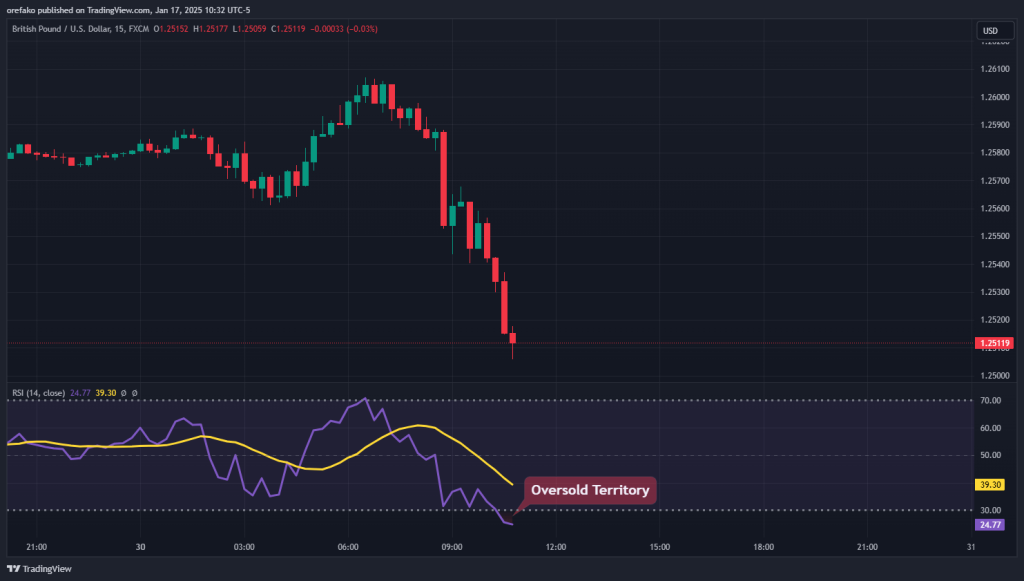
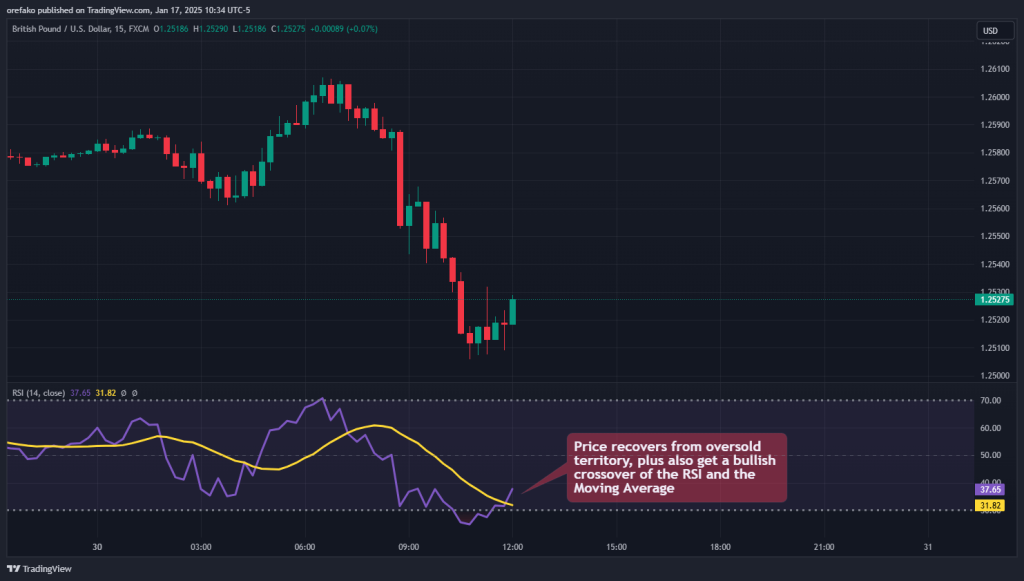
Of course, the first step is to wait for the price to enter the overbought or oversold region, which means the RSI line goes beyond 70 or below 30. The next step is to watch the pair closely until the indicator reverses from this range. Your signal is the crossover between the RSI line and the Moving Average line outside this region. You open your trade at the close of the candle where the RSI recovers from the oversold/overbought region and the indicator lines crossover conditions are met.
Let’s see our GBPUSD example. First, notice that we’ve dipped into the oversold region (below 30 on the RSI). This means we’re looking for long trades.
Next, the price breaks above the 30 boundary, quickly accompanied by the bullish crossover of the RSI and MA lines. This is our signal to buy.
Trade Management
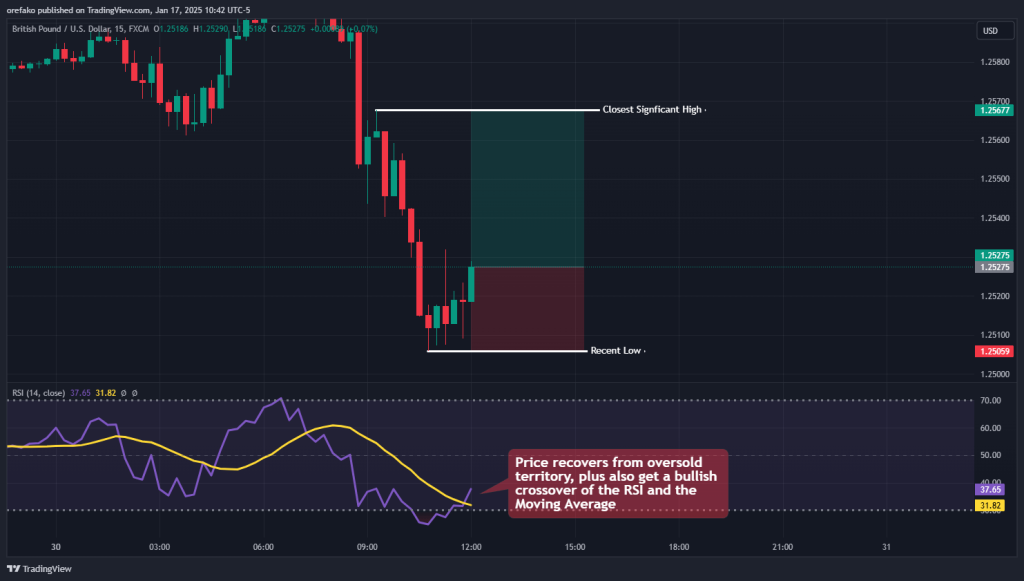
Place your stop loss below the most recent high or low on the chart and aim at the next significant high or low for your profit target.
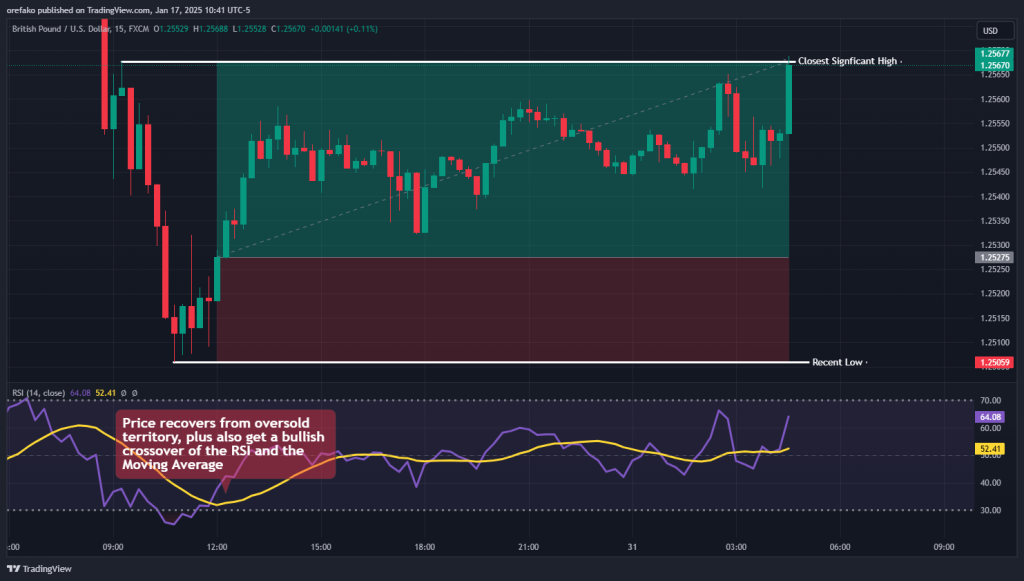
This is what we did in our GBPUSD trade, where we placed our stop loss below the recent low and targeted the next significant high as our profit target.
The image below is how the trade turns out.
Trading Overbought and Oversold Free PDF Download
Here’s a free Overbought and Oversold conditions PDF you can always refer to whenever you need it:
Common Mistakes to Avoid when Trading Overbought or Oversold Conditions
1. Oblivion to the Peculiarities of Various Assets
There are some assets that, by nature, tend not to follow this rule. Why? Because they have underlying fundamentals that continue to push the price in one direction over time, regardless of the overbought and oversold conditions. Examples include stocks of companies with strong growth prospects.
2. Overemphasizing the Impacts of Overbought and Oversold Signals
Another potential mistake is to assume that overbought or oversold conditions always lead to trend reversals. As a matter of fact, most overbought or oversold conditions only bring a retracement to the market. The overall trend still prevails. And while you can still take trades based on overbought and oversold signals contradicting the trend, be mindful that the trade may not go so far.
3. Acting Too Early
Newbie traders fall for this a lot. They see an asset in an overbought or overlord region, and they immediately buy or sell. Don’t do this. Assets can remain overbought or oversold for long periods.
What you should do instead is to wait for a confirmation that the price is about to reverse in the direction you’re expecting to. Only then should you place an order.
4. Forgetting the Broader Market Context
Ultimately, the overall market context is what matters. A bearish asset is unlikely to suddenly become bullish on the daily timeframe because a 15-minute indicator suggests that the price is oversold.
The best thing to do here is to extend your targets when the overbought or oversold signal is in the direction of the general trend. And when you’re trading against this general trend, you’ll know to limit your profit target.
Final Word
Overbought and oversold conditions can be powerful signals when used correctly, as they offer you a glimpse into potential market reversals or continuation opportunities. However, they are not guaranteed. Markets can remain overbought or oversold longer than expected.
Frequently Asked Questions
Let’s see answers to common questions about overbought and oversold
What is the best indicator of overbought and oversold?
The Relative Strength Index (RSI), which ranges from 0 to 100, is widely regarded as one of the best indicators for identifying overbought and oversold conditions. It is typically used to determine whether an asset is overbought (above 70) or oversold (below 30).
Other effective indicators include the Stochastic Oscillator, Bollinger Bands, and the MACD.
Ultimately, the “best” indicator depends on your trading strategy, the market being analyzed, and the timeframe in focus. But you don’t necessarily need to limit yourself to one of these indicators. The Stochastic RSI indicator, for instance, combines the strengths of both indicators to make a good overbought and oversold indicator.
What is the best RSI level for oversold and overbought?
The best RSI level for identifying oversold conditions is typically 30 or below, and the best RSI level for overbought conditions is ideally 70 or above. These are the default settings on the RSI indicator.
However, you can tweak these figures to suit other trading conditions, like when you have a strong uptrend or downtrend or want to adjust the indicator’s sensitivity to the chart.
For instance, oversold levels may occur at slightly higher RSI values during strong uptrends and vice versa during strong downtrends.
Risk Disclosure: The information provided in this article is not intended to give financial advice, recommend investments, guarantee profits, or shield you from losses. Our content is only for informational purposes and to help you understand the risks and complexity of these markets by providing objective analysis. Before trading, carefully consider your experience, financial goals, and risk tolerance. Trading involves significant potential for financial loss and isn't suitable for everyone.


