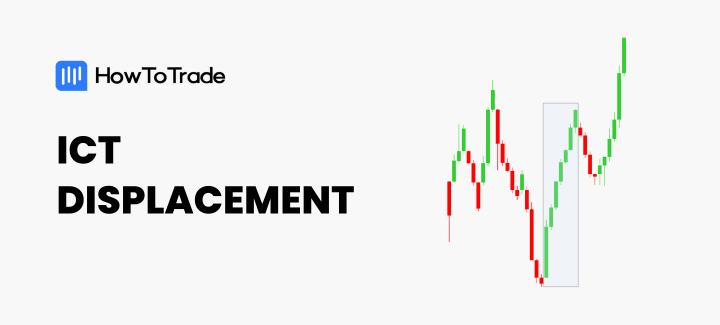
- ICT Displacement appears as consecutive strong candlesticks in one direction, preferably leaving fair value gaps behind
- Displacement helps the retail trader predict where likely institutional activity is and in what direction.
- Some of the benefits of the ICT displacement involve using it to confirm supply and demand zones, trade entries, and market structure bias
The concepts of inner circle trader (ICT) and smart money concept (SMC) trading hinge on the idea that big institutional players in the forex market influence the direction in which the price goes. As a result, the job of traders using these concepts has always been to determine where these big players have entered their trades and what direction they’re facing. Displacement is one of the tools these traders use.
With the understanding of displacement, you can get a glimpse of the actions of smart money traders, which helps you make better-informed trading decisions.
In the rest of this piece, you will learn:
- What displacement is in ICT trading,
- How to use displacement in your trading,
- How to identify it on the charts,
- And how to trade it.
 Table of Contents
- What is ICT Displacement?
- How Do You Use ICT Displacement in Your Trading?
- How Do You Identify ICT Displacements?
- The ICT Displacement Trading Strategy
- What are the Benefits and Limitations of Trading Displacement?
- Extra Tips on How to Trade ICT Displacement
- Frequently Asked Questions about ICT Displacement
What is Displacement in ICT Trading?
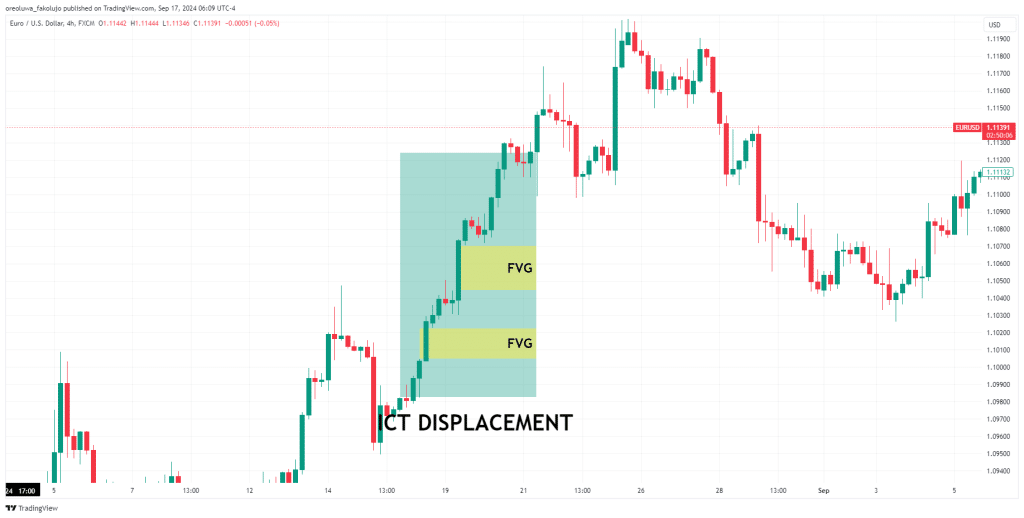
ICT Displacement is a sudden, significant price movement or infusion of momentum into the market in a particular direction. It suggests that institutional traders, also known as smart money, have entered the market, and this is reflected in your chart as strong movements in a particular direction, typically leaving Fair Value Gaps behind.
Types of Displacement in ICT
Displacement can be bullish or bearish, depending on the direction of the strong movement.
1. Bullish ICT Displacement
A bullish displacement move suggests that institutional investors have entered the market, introducing strong buying pressure. You’ll see this as three or more strong bullish candlesticks with little wicks and clear FVGs on lower timeframes. On higher timeframes, such as the weekly, this displacement may only be two candles long. However, when you zoom in on the price action on the lower timeframe, you’ll notice that the price has made significant price movements in the upward direction.
2. Bearish ICT Displacement
A bearish displacement is what you see on your chart when institutional investors force a strong selling pressure into the market. On lower timeframes, this appears as strong, consecutive bearish candlesticks with little or no wicks and clear FVGs left behind. And on higher timeframes, you may see the displacement as two strong, bearish candlesticks.
This is not to say, though, that you can’t have strong three-candlestick formations forming the displacement on the higher timeframe. If this happens, even better.
How Do You Identify ICT Displacements in 2 Steps?
Identifying displacement is quite easy if you know where to look and what to look for.
1. Where to look: Supply and Demand Zones
The best places to look for tradeable displacement are those places where you expect a reaction. And for ICT many traders, those are supply and demand zones. For you, this could be a fair value gap, an order block, a breaker block, a mitigation block, or any other ICT concept that serves as a support or resistance for the price.
2. What to Look For: FVG and Strong Price Movements
Strong market movement is pretty much what we call displacement. On smaller timeframes, displacement often looks like three or more consecutive candlesticks with large bodies. And if there are fair value gaps in between, that would be even better. On higher timeframes like the weekly or the monthly, though, it’ll often appear as one or two strong candlesticks.
Displacement is often more effective during key trading times like the London and New York Kill Zones when institutional traders are most active. Outside of these sessions, identifying true displacement can be more challenging, as the market may lack the necessary volume.
How Do You Use ICT Displacement in Your Trading?
Displacement is one of the most underrated tools in the ICT concepts toolbox. It is underrated because it reveals a great deal about the intentions of smart money traders. And when you know the intent of the smart money, there are so many things you can do with this knowledge.
So, here are ways to use the ICT displacement in your trading:
1. Confirmation of Zones
You can use ICT Displacement to predict the reliability of supply and demand zones. Remember that when the big boys place a trade, they do it in bits. But even those bits tend to be relatively huge amounts. Otherwise, the market would hardly move. So, when these bits of entries get into the market, the price reacts with displacement in the direction of their bid.
The bottom line is this: where there is significant displacement, there is a high likelihood that smart money activity was involved. And if there was smart money activity there, chances are that some of their orders are still waiting to be filled at those zones.
2. Confirmation of Entry Signals
You can also use ICT displacement as a signal on when to enter the market. For instance, assume there’s a supply or demand zone you’ve set your sights on. The idea is that there are still unfilled institutional orders in those zones. But how do you truly know that there are unfilled orders there?
If you said displacement, then you’re right. So, if the price gets to your supply or demand zone and you get a displacement as the price reverses in your direction, that is a signal that your zone was good.
However, note that you may get displacement in one direction with all the order blocks and other concepts supporting your trend direction, but the price eventually reverses in the other direction. This does not mean your supply or demand was wrong. It simply means that there were only enough orders to push the price as far as it went before other big-money players chose to move the price in the opposite direction.
3. Confirmation of Market Structure Bias
If you see price displacing in one direction, that is a clear indicator that the market structure is strong in that direction. For instance, if we get a strong displacement where the price breaks structure to the upside, we know that the bullish trend is strong.
We may begin to look for bullish opportunities. If the displacement is so strong, many professional traders tend to get a little more aggressive with their trades in that direction, which makes sense. You want to ride that powerful move while it’s still ongoing.
Similarly, if the displacement leads to a change of character or a market structure shift, then you know that the trend will likely change direction.
The ICT Displacement Trading Strategy
There are multiple ways to trade displacement once you understand what it means. However, in this section, we’ll show you how to use displacement to validate a supply-and-demand zone and then how to use it to confirm your entries.
1. Trade Setup
You can’t place entries based solely on displacement. You need other concepts, such as supply and demand zones, fair value gaps, order blocks, breaker blocks, and others, to come together. Let’s do our market analysis on the EURUSD chart in the 4-hour timeframe.
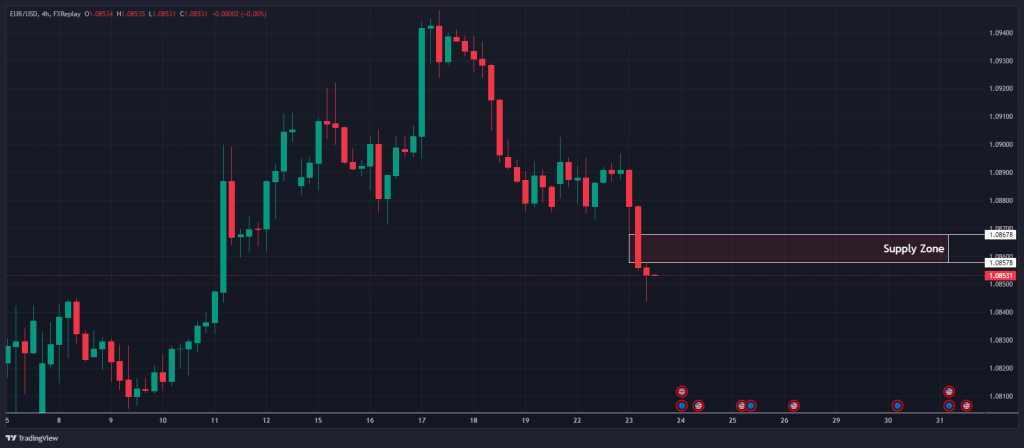
We see a supply level in the form of an FVG waiting as the price approaches it. The first thing we noticed about this supply was that it was a strong displacement move. This also came after a market structure shift from bullish to bearish. All these suggest that there was clearly institutional activity in that supply zone.
But you see, the supply zone on a higher timeframe is wide, spanning from 1.08678 to 1.08578. There’s no way to know precisely where within the supply zone the institutional order was placed to cause this displacement. It could be 1.8630, 1.98588, or even a little past the upper boundary at 1.8700.
You could place your entry at the bottom of this higher timeframe demand zone, place your stop loss at the top, and forget about it. But your profit margin may be low. In addition, there’s no way to know for sure if there are still institutional orders resting at that zone.
Alternatively, you could switch to a lower timeframe to refine your zone and capture a potentially higher profit margin.
2. Trade Entry
Next, we go to the lower 1-hour timeframe to see how the price reacts at this level. And what do we see?
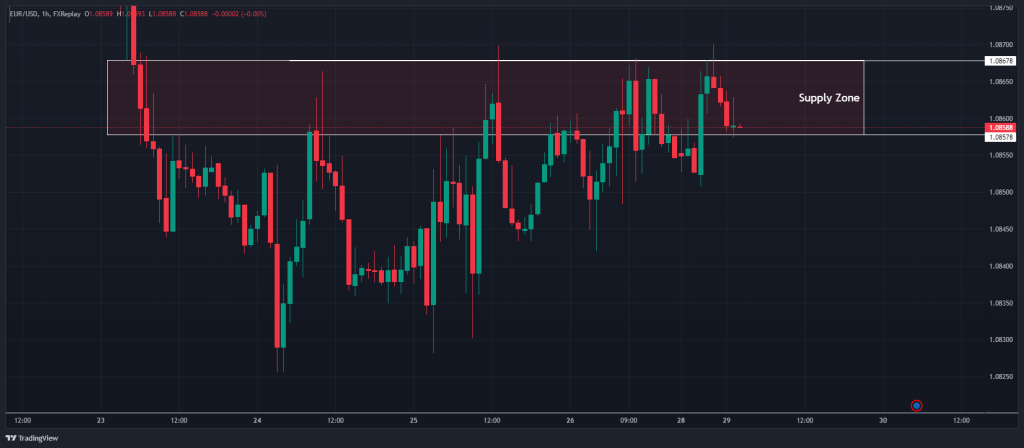
The price appeared to be making a market structure shift repeatedly, but note that there was no displacement. Price action looked shaky. There was no “life” in those moves. This was likely a sign that we had yet to reach the institutional activity area.
But as time goes on, what do we see? We get a bearish ICT displacement move that leads to a bearish market structure shift and even leaves an FVG behind! Now, that’s exactly what we want to see as a sign that we’ve triggered our institutional orders.
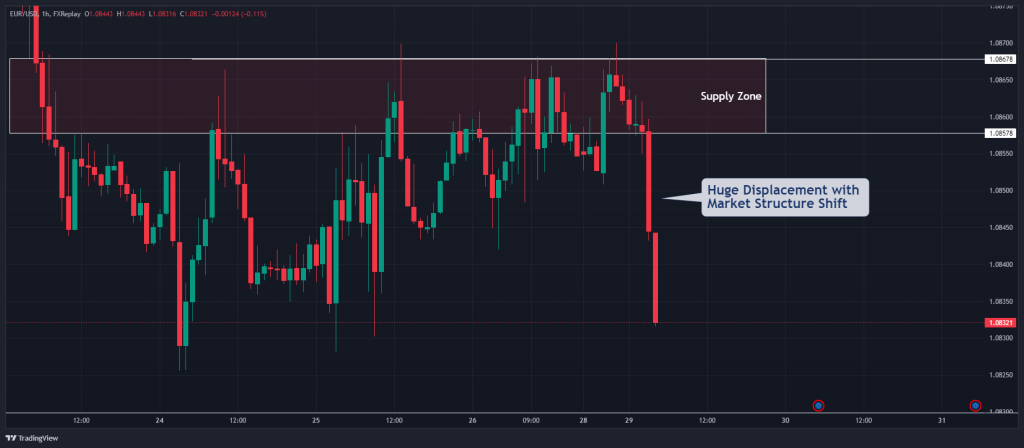
One way to enter is to place your limit order at the FVG. Another approach is to pursue a direct market entry. Method one is the more conservative and higher risk-reward option. But you risk missing the trade. That’s what we do, and for a while, it looks like we’re late to the party as the price goes ahead without us.
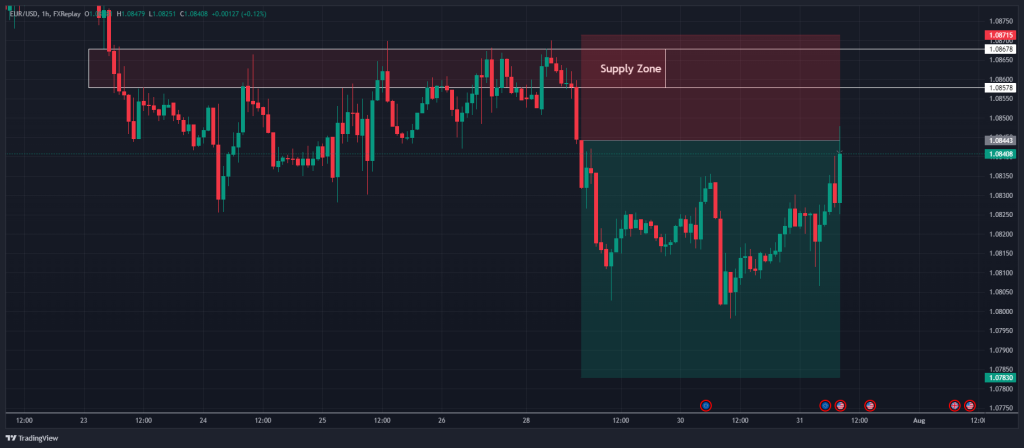
However, the market reverses to our entry to tag us in.
The second way to enter is to simply make a market entry as soon as our trade idea is confirmed, without waiting for a retracement. This way, we can be sure we’ll be part of the move. However, the limitation of this method is that our profit margin will be lower.
Another way to enter is to use concepts like the Optimal Trade Entry.
3. Risk Management
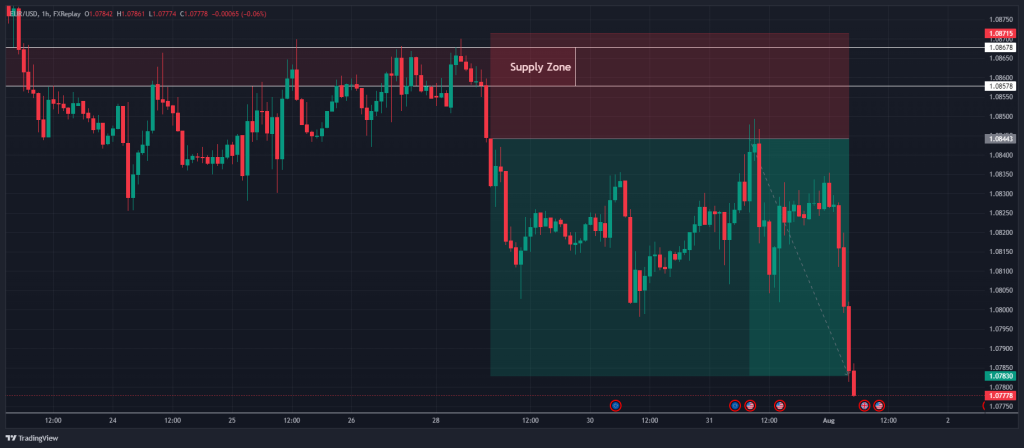
Place your stop loss above your zone and take your profit at any significant liquidity area on the other side. You can also keep things simple by using a risk-to-reward ratio of 1:2 or 1:3, which we did in our example.
What are the Benefits and Limitations of Trading Displacement?
Let’s see some of the benefits and limitations of the ICT displacement
Benefits of Using ICT Displacement
The first and most apparent benefit of displacement is that it helps you identify strong momentum in a particular direction, providing a clear signal of institutional involvement. It can confirm a new trend, a continuation, or a reversal, giving you a reliable directional bias. When you recognize these moves early, you can enter trades at the start of significant price moves.
Let’s look at another benefit.
Since displacement often signals that institutional traders are entering the market with large orders, it provides insight into where “smart money” might be heading. This understanding allows you to align your trades with institutional flow. Even if you didn’t catch the initial significant move, you can tell the trend’s general direction and plan your trades accordingly.
Another benefit of the ICT displacement concept is its potency when combined with other ICT concepts, just like we did in our trading example above.
Limitations of Using ICT Displacement
The first limitation of displacement is that it can be tricky to use. Why? Because not every large move represents institutional involvement. Sometimes, price spikes can result from short-term liquidity sweeps, retail orders, or news events that don’t lead to sustained price movement, creating potential false signals.
Another potential limitation is that displacement alone is not a sufficient trading signal. It needs to be understood in the context of market structure, liquidity, and other ICT concepts. Without that context, it can be misleading and lead to incorrect market assumptions.
Also, volatility spikes, which can lead to slippage when entering or exiting trades, can happen during strong displacement moves.
Extra Tips on How to Trade ICT Displacement
As you go on a displacement trading spree, these are tips that will keep your trading account safe:
1. Wait for Market Structure Break Confirmation
Displacement is most effective when it aligns with a break of structure (BOS) or Market Structure Shift (MSS). Before entering a trade based on displacement, ensure the price has broken through a key support or resistance level. This confirms that the market may be changing direction rather than just experiencing a temporary spike.
2. Combine Displacement with Fair Value Gaps (FVG)
After a displacement occurs, the price often leaves Fair Value Gaps (imbalances) as it moves rapidly. These gaps tend to get filled during a retracement, offering excellent entry points for traders. So, you can wait for the price to retrace into the FVG before entering. This way, you can jump on lower-risk entries while still taking advantage of the momentum.
3. Monitor the Kill Zones
ICT Killzones are periods when liquidity is high, and displacement is more likely to lead to sustained moves due to institutional involvement. So, displacements during ICT Killzones are likely to be more reliable. Conversely, displacement outside of these zones may not be as reliable.
4. Be Aware of High-Impact News Events
Displacement can be triggered by significant news events or economic reports. Trading during these times can be risky, as the price might spike temporarily before reversing or consolidating. So, avoid trading displacement right before or after major news releases unless you are comfortable with the increased risk and volatility. Check an economic calendar regularly to stay updated.
5. Focus on Major Currency Pairs
Displacement moves tend to be more reliable in major currency pairs, which are more liquid and have greater institutional participation. Pairs like EUR/USD, GBP/USD, and USD/JPY are prime candidates for trading displacement as institutional players heavily trade them.
This is not to say that there aren’t displacement moves on other pairs. We’re only saying that if you know where the playground of the big boys is, you should be there as well.
Frequently Asked Questions about ICT Displacement
Here are answers to some of the most frequently asked questions about displacement in ICT trading methodology:
What is a Balanced Price Range?
A Balance Price Range is a market condition where the price displaces up and down, leaving fair value gaps that overlap on either side of the move. This phenomenon results from the manipulation of the market by smart money traders. And the double fair Value gap overlap signifies an area of high interest for retail traders, as the price is likely to return to it before reversing.
How Do You Identify Displacement in Trading
Displacement appears on the chart as three or more strong candlesticks in the same direction, leaving fair value gaps behind. However, if you find two consecutive strong candlesticks on higher timeframes like the weekly or monthly, this is also displacement.
Risk Disclosure: The information provided in this article is not intended to give financial advice, recommend investments, guarantee profits, or shield you from losses. Our content is only for informational purposes and to help you understand the risks and complexity of these markets by providing objective analysis. Before trading, carefully consider your experience, financial goals, and risk tolerance. Trading involves significant potential for financial loss and isn't suitable for everyone.


