If you have been trading for a while, you’ll notice that not all moving averages are equal. Some perform well under certain market conditions, while they can perform poorly in other conditions. And since you don’t have all the time and money in the world to try out which one will work for you, we have taken it upon ourselves to help you find the best moving average for the swing trading strategy.
Before you dive into the main article, let’s give you a quick rundown of the major key points of this article:
- Moving averages aid swing trading by smoothing price fluctuations and revealing underlying trends, improving trade decision-making.
- In addition to single MA/EMA, crossovers of MAs provide valuable signals for trend changes, entry/exit points, and momentum shifts, enhancing trading effectiveness.
- There’s no one-size-fits-all “best” MA for swing trading; however, some of the best moving averages and MA crossover for swing trading include the 21, 15, 50, and the 13/26 and 50/200 crossovers.
So, in this article, you’ll learn:
- Use cases of moving averages in swing trading
- The different types of moving averages
- The difference between using a single moving average and a moving average crossover
- The best moving average for swing trading and how to use it
 Table of Contents
Why Are Moving Averages So Effective in Swing Trading?
Swing trading, with its focus on capturing price swings over days or weeks by exploiting market volatility, comes with its set of challenges. But this article on swing trading moving averages (MAs) will help you identify trends, pinpoint entry/exit points, and, ultimately, boost your trading success.
Imagine this: You’re staring at a price chart, waiting to “buy the dip”. How do you know if it’s a temporary dip or a full-blown downtrend? Moving averages can certainly be the answer. Not only because they are accurate trading indicators but also because many other traders look at the same indicator, which means that these levels become key levels in trading.
Here’s how MAs become your swing trading secret weapon:
- Trend Identification: Observing the angle of the MA, you can gauge the trend. A rising MA signals an uptrend, while a falling one indicates a downtrend. This clarity helps you align your trades with the current market direction, increasing your chances of catching profitable moves.
- Support & Resistance: MAs often act as psychological support and resistance levels. When the price approaches a rising MA, it might find support there, potentially bouncing back up. Conversely, a falling MA might act as resistance, causing the price to stall or even reverse. By recognizing these support and resistance levels, you can strategize entry points near support and exit points near resistance, maximizing your potential gains.
- Confirmation & Timing: MAs don’t predict the future, but they can confirm your analysis based on other indicators or chart patterns. For example, a bullish crossover (when a shorter-term MA rises above a longer-term MA) might add confidence to your buying decision. Additionally, MAs can help with timing, suggesting potential entry/exit points based on their interaction with the price action.
In sum, moving averages are crucial in identifying key levels to enter and exit positions, largely because they are extremely easy to use and since they are viewed by many other traders as well. Remember, swing trading is not about making many trades. It is more about seeking short to medium-term trades, and every trade should be carefully analyzed. And moving averages are a great tool to do that.
Types of Moving Averages
Swing trading demands adaptability, and your choice of moving average (MA) should reflect that. Here’s a quick rundown of popular MAs to equip your trading toolkit:
- Simple Moving Average (SMA): This is the most popular of the MAs; it takes the average price over a chosen period. Easy to understand but slow to react to recent price changes.
- Exponential Moving Average (EMA): Also known as “the” smoothed moving average, the EMA assigns more weight to recent prices, making it more responsive than the SMA. Great for identifying long-term trends and potential reversals.
- Weighted Moving Average (WMA): It assigns customizable weights to different price points, allowing you to focus on specific periods within the timeframe.
- Linear Regression Moving Average (LRMA): It uses a statistical approach to fit a line to price data, offering a smoother trendline than other MAs.
- Linear Weighted Moving Average (LWMA): Assigns higher weights to more recent data points, offering a smoother response than the SMA while maintaining clarity. Good for volatile markets.
- Hull Moving Average (HMA): This type of moving average incorporates volatility into its calculations, resulting in a smoother and more responsive average. Ideal for identifying trends in noisy markets.
Moving Averages and Moving Average Crossovers
While both terms might sound similar, there’s a key difference between moving averages (MAs) and moving average crossovers (MACs):
Moving Averages: This refers to the use of a single moving average on a price chart. Moving averages smooth out price fluctuations, revealing the underlying price direction. For example, imagine a 9-period EMA: it takes the average of the closing price over the last 9 periods, offering a clearer picture of the trend compared to individual price bars.
Moving Average Crossovers: These ones occur when two (or more) different MAs intersect, potentially signaling a trend change. For example, a bullish crossover happens when a shorter-term MA (like the 50 EMA) rises above a longer-term MA (like the 200 EMA). This suggests a shift in momentum, potentially indicating an uptrend.
Let’s quickly visualize this to drive home the point.
Using a Single MA for Swing Trading
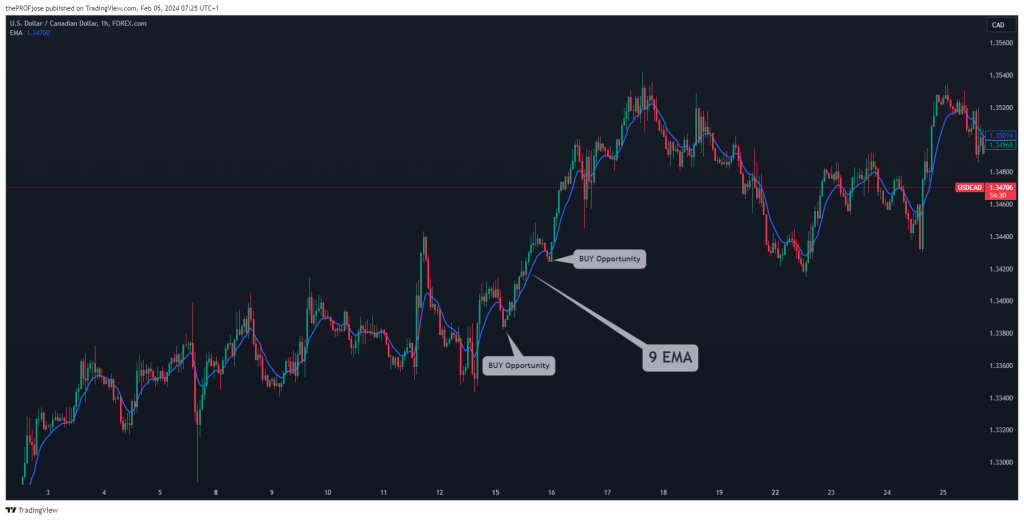
As mentioned, swing traders can use a single moving average indicator on a price chart. The 9 EMA is considered an ideal moving average for swing trading. Let’s see how it works.
Consider the 9 EMA used on the USDCAD chart below. The rising of this EMA above the asset’s price suggests an uptrend, offering buy opportunities near support levels where the price finds temporary dips below the EMA (Exponential Moving Average). Conversely, a falling EMA indicates a downtrend, prompting you to seek potential shorting opportunities near resistance levels where the price struggles to break above the EMA.
As you can see, when using a single MA indicator, the technique is straightforward. You buy the asset when the MA line rises above the price and sell when the MA line falls below the price.
Crossovers in Action
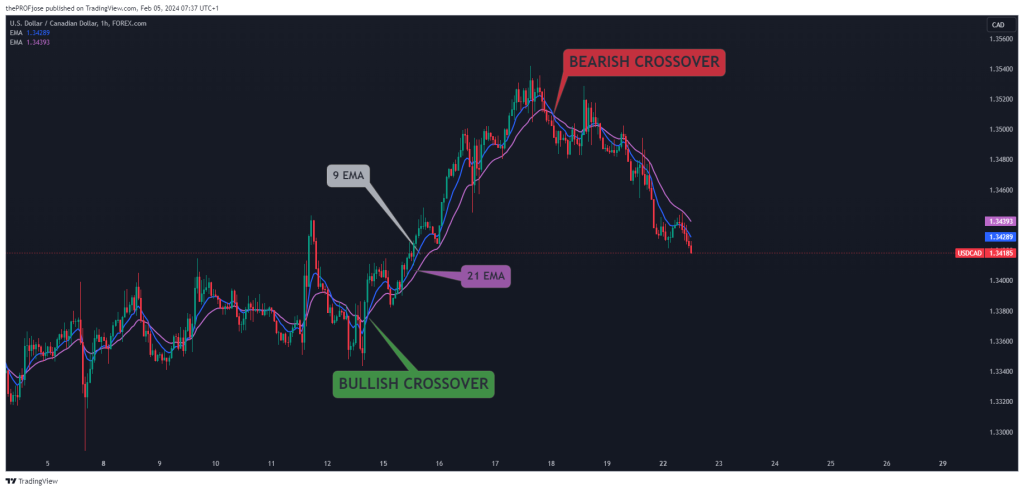
Now, let’s add another moving average, say the 21 EMA, to create a potential crossover. When using the moving average crossover strategy, if the 9 EMA (faster) crosses above the 21 EMA (slower), it’s a bullish crossover, hinting at a possible trend reversal to the upside. This could be a signal to enter a long trade (buying the asset), considering other confirmation factors like increased volume or bullish chart patterns.
Why Do Moving Average Crossovers Matter in Swing Trading?
So, why moving average crossovers are so important in trading? While single-moving averages offer a valuable glimpse into trends, moving average crossovers (MACs) elevate them to another level. They indicate high probability entry and exit points. But what makes them so effective? Let’s find out:
1. Trend Confirmation: A bullish crossover (shorter-term MA rising above longer-term MA) confirms an uptrend, potentially giving you the confidence to enter long positions. Conversely, a bearish crossover (shorter-term MA dipping below longer-term MA) suggests a downtrend and prompts you to consider exiting long positions or seeking shorting opportunities.
2. Momentum Shifts: MACs excel at revealing changes in momentum. A bullish crossover often signifies a pick-up in buying pressure, potentially accelerating price. On the other hand, a bearish crossover might hint at waning buying momentum, indicating a potential price decline. Using these signals, you can position yourself before the momentum shift, potentially maximizing your gains. To increase the chances of success in predicting trend reversals, traders often use other indicators as a confirmation signal. Those include the Relative Strength Index, Bollinger Bands, and the Moving Average Convergence Divergence.
3. Filtering False Signals: While no indicator is perfect, MACs can help filter out some false signals from individual price movements. A single price spike might not mean much. Still, a crossover supported by other technical indicators or increased volume adds weight to the potential trend change, allowing you to make more informed trading decisions.
4. Simplicity & Adaptability: Moving Average crossovers are relatively easy to understand and implement, even for novice traders. Plus, you can customize them to your trading style and asset class. Experiment with different MA lengths and types (EMA, WMA, etc.) to find the MAC combo that resonates with you.
All in all, although using a single moving average is considered an effective trading tool, moving average crossover offers a much more comprehensive trading approach. For more information, you can visit our guide about the 8, 13, and 21 trading strategy and the triple moving average crossover strategy.
What is the Best Moving Average for Swing Trading?
Forget the quest for a one-size-fits-all “best” moving average in swing trading. The truth is the ideal choice depends on you, your trading style, and the market you’re trading. Like choosing the perfect suit, it’s all about finding the perfect fit. However, in trading, there’s always a popular indicator or a moving average crossover used by many traders. So, based on our experience and research, there are a few moving averages and moving average crossovers we can recommend you check out and backtest for yourself; These include, among others, the 21 MA/EMA, the 15 MA/EMA, and the 50 MA/EMA.
In addition, swing traders often use moving average crossovers to identify trade signals; here they are:
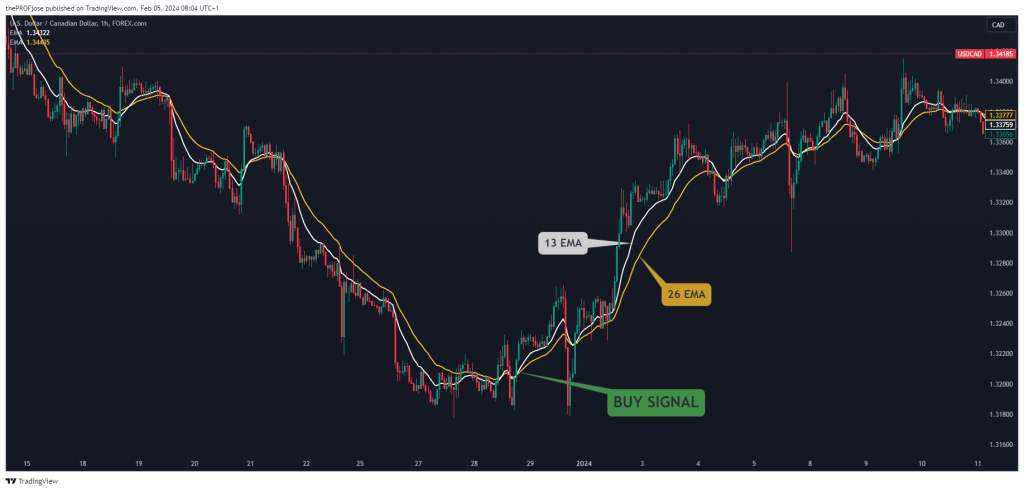
13 EMA and 26 EMA Crossover
Most expert traders consider the 13 and 26 EMA crossover one of the best moving averages for swing traders, and for good reasons: it is really easy to set up and also to trade, and most importantly, it is said to be an accurate trade indicator.
To enter a buy position, simply wait for the 13 EMA to crossover the 26 EMA, as shown above. On the other hand, you can expect the market to sell after the two EMAs (Exponential Moving Averages) crossover to the downside.
Note that while you can trade these crossovers alone, some prefer to pair them with support and resistance zones to get “sniper entry” and filter out low-probability setups.
50 EMA and 200 EMA Crossover
Another popular moving average crossover for swing trading is the 50 EMA and the 200 EMA. They have been dubbed “institutional moving averages” because they are being used both amidst hedge funds and institutional traders, and they can be found in classic forex trading books.
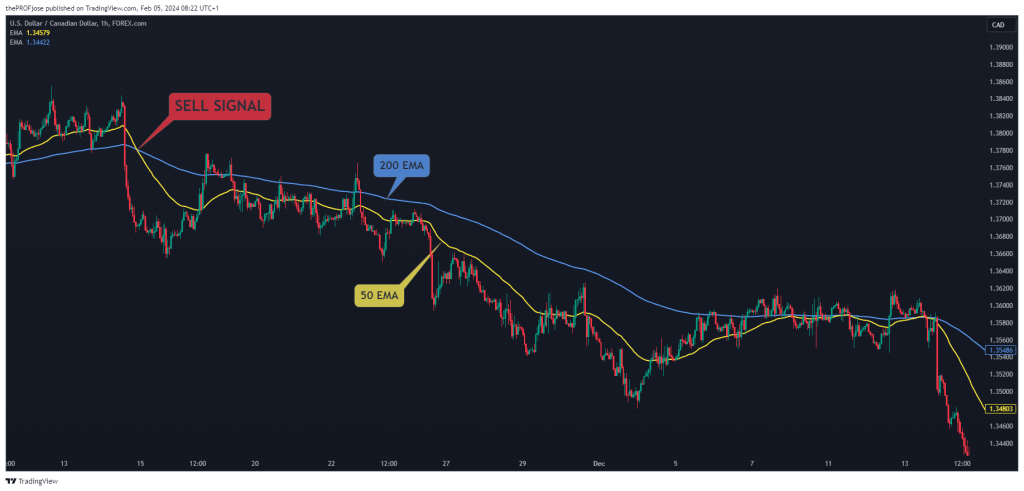
There are several ways to trade with these moving averages, but the experts suggest trading the 50 and 200 EMA crossovers in their simplest form, as shown in the chart above. That is, to look for a crossover between the two EMAs. And to optimize for more profit, aim at a 2.5 Risk-Reward Ratio.
At last, it’s important to mention that having a good risk management game plan in place is the magic piece that makes all trades work, including the above strategy. So, ensure you backtest these strategies to gain confidence before trading them in a live market environment. Additionally, we also suggest to read one of our most recommended swing trading books, and visit our Trading Academy.
Risk Disclosure: The information provided in this article is not intended to give financial advice, recommend investments, guarantee profits, or shield you from losses. Our content is only for informational purposes and to help you understand the risks and complexity of these markets by providing objective analysis. Before trading, carefully consider your experience, financial goals, and risk tolerance. Trading involves significant potential for financial loss and isn't suitable for everyone.


