The Positive Volume Index (PVI) indicator is a volume-based tool that highlights trading days and periods with increased market activity, offering insights into potential price trends driven by institutional investors.
- The Positive Volume Index (PVI) tracks price changes only on days when trading volume increases.
- PVI is often used to signal “smart money” movements, reflecting institutional trading behaviors.
- Traders can combine PVI with other indicators, like the Negative Volume Index (NVI), to better gauge market trends.
- The indicator’s selective tracking of high-volume days aids in identifying trend continuations and potential reversals.
- PVI works best in high-volume markets, where it can provide clearer signals of potential price movements.
This article explores the Positive Volume Index indicator, showing you how it highlights high-volume trading days and periods to track potential “smart money” movements. You’ll learn how PVI works, when it’s most effective, and how to set it up on platforms like MetaTrader and TradingView to enhance your trading strategy.
 Table of Contents
What is the Positive Volume Index (PVI)?
Most volume-based indicators work in similar ways. For instance, most of them basically track overall market sentiment. The Positive Volume Index (or PVI), on the other hand, tries to capture market movements only on days or timeframes when trading volume increases. Originating in the mid-20th century, this indicator has grown in popularity as traders realized its potential to provide insights into price behavior during key market days.
While this may not sound revolutionary, it’s predicated on a sound assumption: larger volumes reflect institutional traders’ activities. So, tracking such movements may get traders better results in both bull and bear markets compared to using the traditional approach. It is, therefore, one of the most used indicators when applying the institutional trading strategy.
If we look a little closely under the hood of the indicator, we will find out that the PVI calculates the daily percentage change in price only when there is an increase in volume from the previous day. This selective tracking enables the PVI to highlight days of notable investor interest or activity, helping traders anticipate potential market trends.
So, if you are one of those traders who are much more particular about trading like “smart money,” the PVI indicator may as well be a valuable tool for you.
How Does the Positive Volume Index Work?
Let’s go back to how the positive volume index indicator calculates volume changes. The formula updates only when the day’s trading volume is higher than the previous day’s volume. This, obviously, can also applied to shorter timeframes; however, here, we’ll be focusing on the daily timeframe to emphasize how the PVI indicator works.
So, if today’s volume is greater, the PVI adjusts based on the percentage price change; otherwise, the PVI remains unchanged. This selective approach ensures that the PVI reflects only days when trading intensity increases, which, in theory, are days of heightened interest or speculation.
Here’s the basic mathematical formula for the PVI:
PVI(t) = PVI(t-1) + [Price Change % x PVI(t-1)]
Where:
PVI(t) = Today’s volume index
PVI(t-1) = Yesterday’s volume index or Previous Volume Index
In simpler terms, if today’s volume exceeds yesterday’s, the PVI adjusts according to the percentage change in price. If not, the PVI for that day remains the same.
Let’s break down an example: if the PVI yesterday was 1,000 and today’s price rose by 2% on higher volume, the new PVI would be 1,020. This method gives the PVI its unique ability to highlight days of potentially significant trading activity.
A rising PVI generally indicates buying interest, as higher volumes typically accompany upward price movement. In this case, a buy signal is given. Conversely, a declining PVI suggests a potential bear market and provides a sell signal.
In short, the PVI’s trend can often be interpreted as a reflection of market sentiment—when the PVI is in an uptrend, it implies bullish conditions, while a downtrend might signal bearish sentiment.
Interpreting the PVI in Market Conditions
Many traders use the PVI in combination with other “not so smart money” indicators to identify potential bullish or bearish conditions. For instance, if the PVI is rising alongside the price, it can indicate a strong, volume-backed uptrend.
On the other hand, if the PVI is declining while the price is rising, it might signal an upcoming downturn as trading interest dwindles. It is, therefore, an excellent indicator to incorporate as part of the volume trading strategy.
How to Use the Positive Volume Index in Trading
We hardly recommend using the Positive Volume Index alone while performing technical analysis. Rather, when combined with other technical analysis indicators, the indicator can sharpen a trader’s ability to interpret market trends.
That said, many traders pair PVI with other indicators like the Negative Volume Index (NVI) to gain a fuller picture of market conditions, while others integrate it into different trading strategies to confirm trends or spot potential reversals. Honestly, there’s no limit to how you can use this indicator. However, let’s explore some popular strategies that make the most of PVI in trading.
1. Confirming Bias in a Trending Market
In bullish markets, traders often look for additional confirmation before entering a long position. The PVI can be quite helpful here: if both price and PVI are trending upward, it can signal a strong uptrend supported by high volume, giving traders confidence in the momentum.
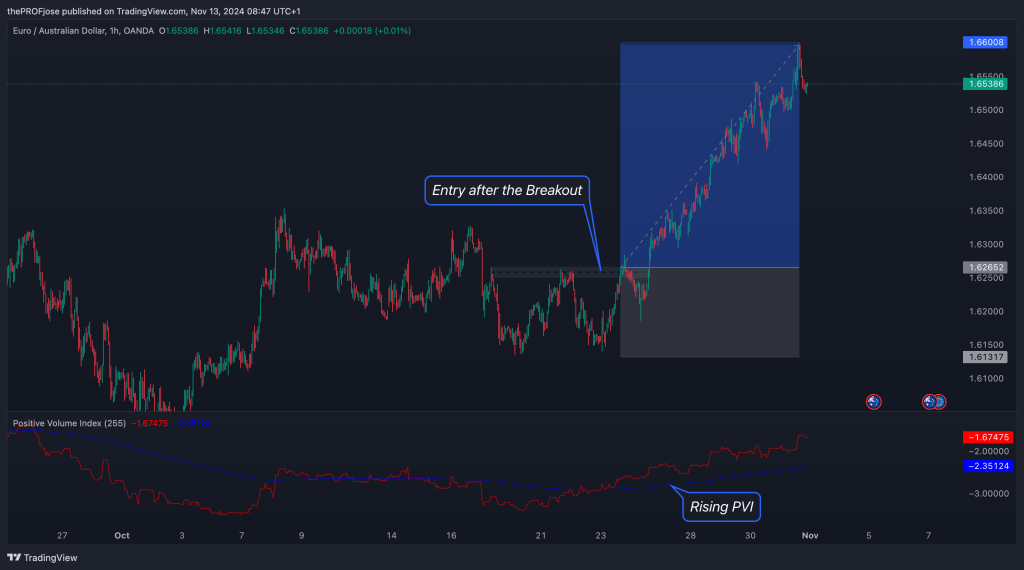
In this scenario, a trader can use this insight to enter a long position in different ways. One smart way is to wait for the price to break from a key resistance before jumping into a buy position, as shown in the chart above.
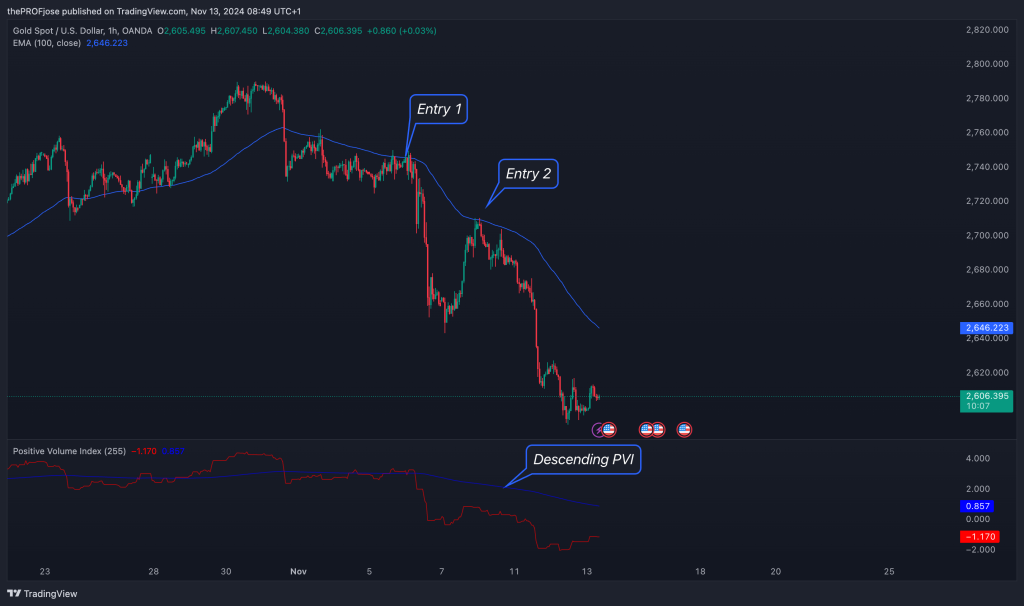
Another way to confirm an uptrend (or downtrend) in the market is to use the PVI alongside moving averages, trend indicators, or even other price accumulation volume indicators, such as the volume profile indicator, or the on-balance volume indicator. Combined with these tools, the PVI can act as a confirmation layer that reassures traders they’re entering the market at an optimal point, backed by volume-driven price movements, just as shown above.
2. Spotting Potential Reversals
Reversals can be tricky to identify, but the PVI helps traders catch early signs. In a downtrend, if the PVI starts to rise even as prices continue to fall, it may indicate that volume-driven traders are beginning to accumulate the asset, hinting at a potential reversal. For that purpose, the PVI indicator can often be used to identify short squeezes in stocks or other financial assets. The opposite is also true when dealing with a decreasing trading volume in an uptrend.
This signal is often more effective when combined with other momentum indicators, such as the Relative Strength Index (RSI) indicator or the MACD indicator, to further validate potential buy signals in a fading downtrend.
3. PVI and NVI
One of the most popular ways to use PVI is in conjunction with the Negative Volume Index (NVI). The NVI, in contrast to PVI, focuses on days with lower volume, effectively tracking price movements driven by “quiet” trading.
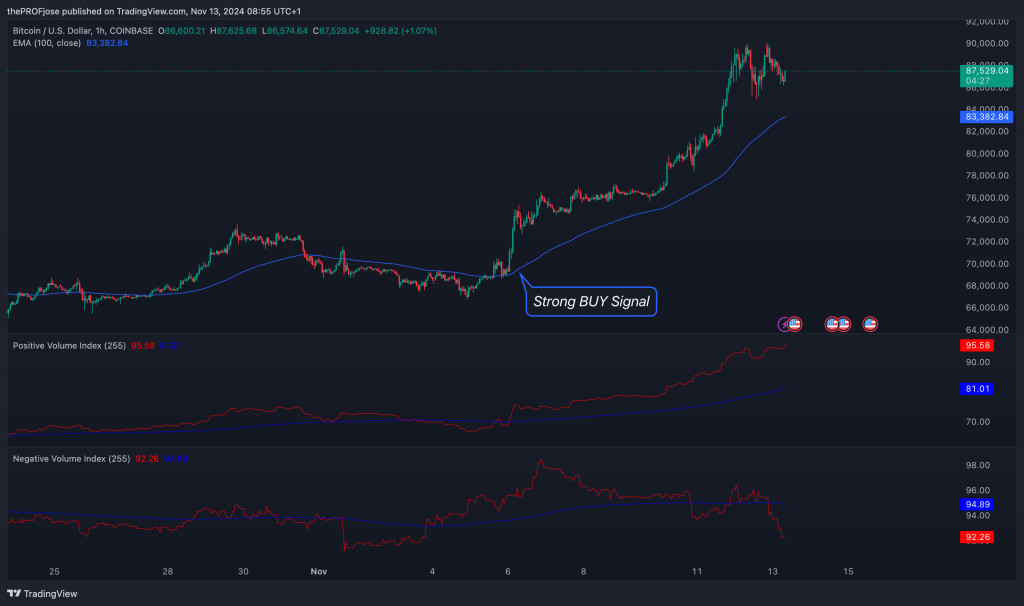
When both PVI and NVI trend upwards, it’s a powerful indication of sustained bullish sentiment. However, if the NVI trends downward while the PVI rises, it can suggest that the rally may not have full support, as less influential market players are driving the activity.
Pros and Cons of the Positive Volume Index
The Positive Volume Index has strengths and weaknesses that can affect its effectiveness. Knowing both the pros and cons of PVI will help you decide when and how to use it effectively in your trading strategy.
Advantages of Using the Positive Volume Index
One of the biggest advantages of the PVI is its ability to help you pinpoint when “smart money” or institutional investors might be influencing price movements.
This makes it a valuable tool for identifying trends that are backed by strong volume, which is often a reliable indicator of potential continuation or reversal. Here are some other pros of using PVI:
Pros
- It is effective for spotting trends that may indicate continuation or reversal
- The indicator works well with complementary indicators like NVI for enhanced accuracy
- PVI helps validate trends when both PVI and NVI show alignment.
Limitations of the Positive Volume Index
Despite its strengths, PVI also has key drawbacks. One key limitation is that it can be misleading in low-volume markets. In markets or assets with low daily trading volume, PVI might produce noise rather than actionable signals, as volume changes in these environments may not be as meaningful.
As a result, PVI may work best when applied to assets with consistently high trading volume, like large-cap stocks, rather than thinly traded assets.
Here are some other cons that are worth paying attention to as you use the indicator:
Cons
- It is optimal for high-volume assets but less effective with low-volume or thinly traded assets
- PVI has limited applicability across different asset classes like forex and commodities
Setting Up the Positive Volume Index on Trading Platforms
Now that you’ve learned a couple of things about the PVI indicator, let’s quickly get you started setting it up on any trading platform like MetaTrader or TradingView.
Setting Up the Positive Volume Index on MetaTrader
MetaTrader doesn’t natively include the PVI indicator, so you’ll need to download a custom PVI script or indicator. To learn how to do that, we suggest you visit our guide on how to download and install custom indicators to MT4/5. Here’s how to get started:
- Download a PVI Indicator: Search for a custom Positive Volume Index indicator online, making sure it’s compatible with your MetaTrader version (MT4 or MT5). Reputable sites often have these for free or at a low cost.
- Install the Indicator: Once downloaded, place the file in the “Indicators” folder within the MetaTrader directory on your computer. For MetaTrader 4, you’ll find this folder under MQL4 > Indicators, and for MetaTrader 5, under MQL5 > Indicators.
- Restart MetaTrader: After adding the PVI file, restart MetaTrader to enable the platform to detect new indicators.
- Add PVI to Your Chart: Go to “Insert” > “Indicators” > “Custom” and select the Positive Volume Index from the list. It will appear as a new line or histogram in a separate window below your main chart.
Setting Up the Positive Volume Index on TradingView
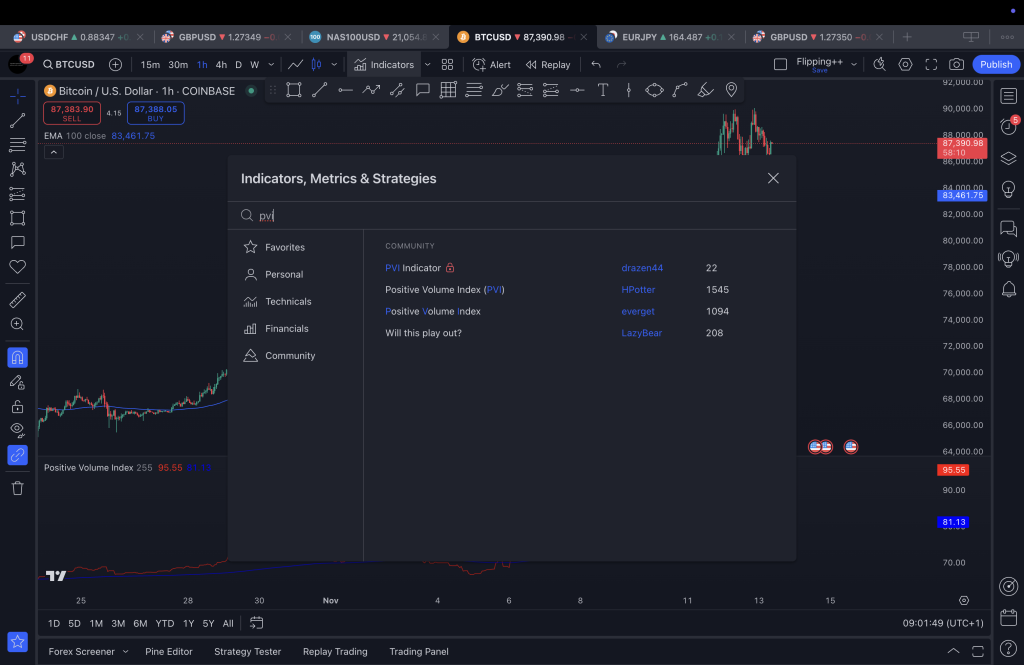
TradingView makes setting up the PVI easy with its extensive indicator library:
- Open TradingView: Log into your account and open a chart for the asset you want to analyze.
- Search for the Indicator: Click on “Indicators” at the top of the screen and type “Positive Volume Index” or “PVI” in the search bar. If the PVI is not listed, look for community-created scripts or build a custom script in Pine Script.
- Add to Chart: Once you find the PVI, click on it to add it to your chart. It will typically appear in a separate panel below the price chart.
- Adjust Settings: Click the gear icon on the indicator panel to access settings for customization.
Key Takeaways
To sum up, here are the key points to remember when trading using the Positive Volume Index indicator.
 Key Takeaways
- The PVI indicator focuses on days of increased trading volume, capturing potential institutional activity that may influence price direction.
- PVI can signal bullish or bearish trends more accurately when combined with other indicators, especially the Negative Volume Index (NVI).
- PVI tends to be more effective with frequently traded assets, where volume spikes represent more reliable signals.
- Traders can set up PVI on popular platforms like MetaTrader and TradingView, using custom scripts if needed.
Frequently Asked Questions About the Positive Volume Index Indicator
Before wrapping up, here are some frequently asked questions about the Positive Volume Index (PVI) to clarify its functions, applications, and best practices.
What is the main purpose of the Positive Volume Index (PVI)?
The PVI helps traders identify trading days with higher volume, which often reflects institutional or “smart money” activity, giving insights into potential market trends.
How does PVI differ from other volume-based indicators?
Unlike typical volume indicators that track daily volume, PVI focuses exclusively on days with volume increases, thus reflecting more notable trading activity.
Can I use PVI alone for trading signals?
It’s recommended to pair PVI with other indicators, such as NVI or trend indicators, to enhance accuracy and gain a fuller picture of market conditions.
What markets is PVI most effective in?
PVI is best suited for high-volume assets, like large-cap stocks, where volume changes are more likely to signal meaningful price movements. Having said that, it can also work on small cap stocks that often have low trading volume. For instance, the PVI can work effectively when using the Russell 2000 as a leading indicator for major US indices. When the PVI presents increasing volume, it can often provide a buy signal for other major US indices and vice versa.
Risk Disclosure: The information provided in this article is not intended to give financial advice, recommend investments, guarantee profits, or shield you from losses. Our content is only for informational purposes and to help you understand the risks and complexity of these markets by providing objective analysis. Before trading, carefully consider your experience, financial goals, and risk tolerance. Trading involves significant potential for financial loss and isn't suitable for everyone.


