The Key Level indicator measures significant historical price points reflecting market psychology and can be used to inform trading strategies by identifying potential entry and exit points.
- Key levels in trading are significant price points on charts, reflecting the market’s history and pivotal moments, representing areas of intense buying or selling.
- A key level indicator automates the identification of these crucial points, aiding traders in strategic decision-making.
- Effective use of key-level indicators involves identifying strong levels of historical support or resistance, waiting for price movement confirmation, and strategically setting orders and stop losses.
In this guide, we are going to cover everything you need to know about the Key Level indicator, including how to use the indicator and implement the Key Level Intraday Breakout Strategy.
What is the Key Level Indicator?
Key levels in trading are specific, significant price points on a chart, reflecting the market’s historical psyche and pivotal moments where asset prices have shown notable reactions. These key levels in trading represent psychological price levels, often areas of intense buying (support) or selling (resistance), where the market’s collective memory has repeatedly confirmed their significance.
These key levels in trading are significant because they embody price action herd behavior in the markets, reflecting the collective actions of traders fixating on certain price points, leading to self-reinforcing market movements. Round numbers, for example, hold psychological sway in trading, often becoming focal points where stop losses cluster and markets react noticeably. They serve as reference points, helping traders gauge market sentiment and anticipate movements. When prices break through these levels, they can indicate shifts in market control, signaling bullish or bearish trends.
In practice, a key level indicator helps traders automatically draw these significant levels on the chart, taking the guesswork out of identifying these crucial price points and enabling a more strategic approach to trading. The purpose of the key level indicator is to provide trading signals by helping traders identify key support and resistance levels.
How to Use the Key Level Indicator in Trading?
So, now that we know a little about what the key level indicator is, here’s the question: how do we use it in trading?
Basically, manually drawing key levels can take a lot of practice before you get them right, even at that, you may not be as accurate. However, when you add the key level indicator to your chart, it automatically plots these key levels on your chart, removing the guesswork from your analysis. It’s as simple as that.
You must also take into account that there are various key-level indicators, and each has different values and accuracy. So, before you set your mind on a specific key-level indicator, you should explore different key-level indicators and backtest those on a demo account.
Regardless, to effectively leverage key-level indicators in trading, you must do the following:
- Identify Strong Levels: Look for price areas that have historically acted as strong support or resistance. These are typically where the price has shown repeated bounce-backs or rejections. It’s important to note that these levels are not precise numbers but zones of increased buying or selling activity.
- Wait for Confirmation: Before entering a trade, wait for the price to show clear movement breaking through or bouncing off the key level. This might come in the form of a price breakout or reversal, providing a more reliable signal for trade entry.
- Set Orders and Stop Losses: Place your trades around these key levels, using them to set strategic stop losses and take profits. For instance, if you’re buying at a support level, you might set a stop loss just below it to protect against the risk of a downward breakout.
- Monitor and Adapt: Trading is dynamic, and so are key levels. Continuously monitor how the market reacts at these levels and be ready to adapt your strategy accordingly. This might mean adjusting your stop loss or taking profits sooner if the market shows signs of reversing.
Key Level Indicator Trading Strategy
Trading key levels is one of the oldest and most consistently profitable strategies in analyzing price behavior. As we’ve mentioned earlier, the Key Level indicator is not a default indicator. It is rather a custom-built indicator that is programmed to automatically mark key levels on the chart.
It, therefore, requires an effort to install it on your trading platform. Still, it’s worth it. This indicator can easily help you find crucial price action levels on a chart. If you are using MT4/5, you can visit our guide on how to download and install custom indicators on MT4/5.
So, for this example, we will be using the “Key Levels by Rife” indicator on TradingView, although the process remains the same on any other platform. Note that in this example, we’ll show you how to utilize the key level indicator to identify breakouts and, hence, apply the breakout trading strategy.
The first step is to add the indicator to your chart and set the indicator parameter as shown in the image below:
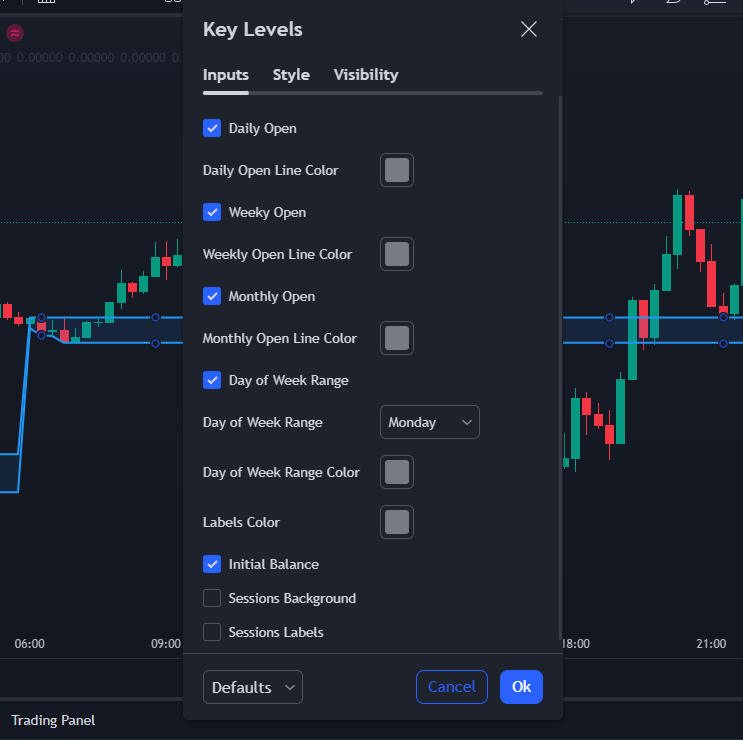
If you used the same setting, you should have a blue range that runs through your chart. Ensure your chart is set to the 15-minute timeframe since this is the ideal timeframe for an intraday trading strategy.
Trade Setup and Entry
Now that we’ve set up our chart, it’s time to go into the strategy itself. The strategy rule is quite straightforward: simply wait for the price to break above or below the intraday range to buy or sell, respectively. The key level breakout is the level where you look to enter a trade.
Here’s an example of a BUY setup:
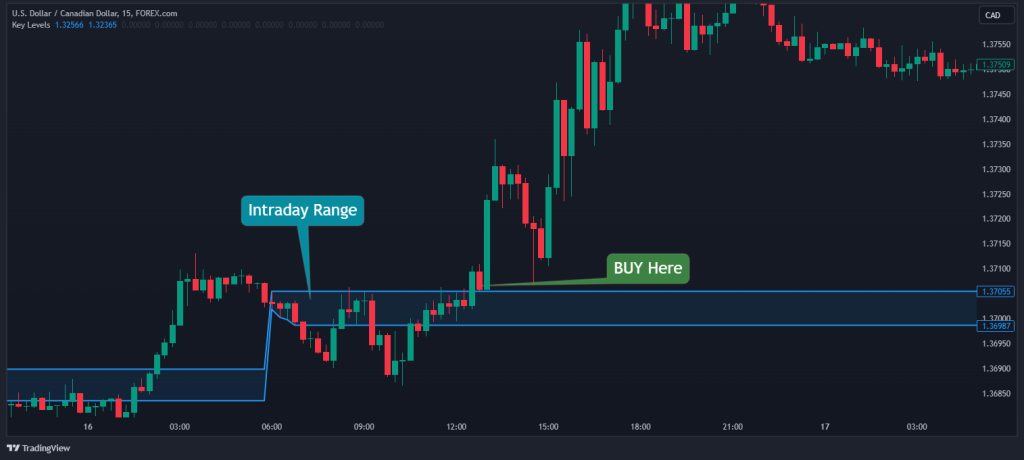
From the chart above, we saw that the price broke above the range and closed with a full-body candle; we can quickly place a BUY trade at the close of this candle.
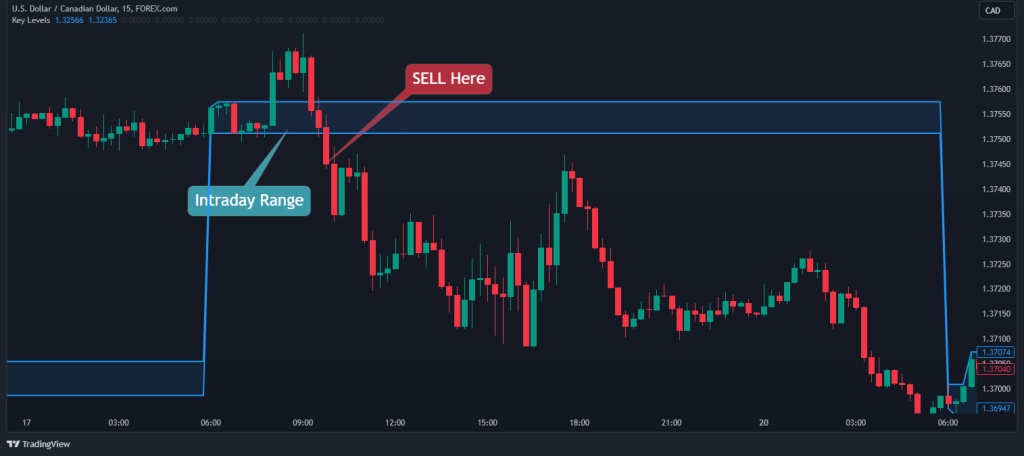
Similarly, here’s a scenario where the price breaks below the range with a full-body candle. We can easily place a SELL trade at the close of the candlestick, as shown below:
Trade Risk Management
So, how do we manage our risk?
According to various sources, the win rate of this strategy is around 80%, showing that we can afford to simply target a one or two-risk-reward ratio. So, in a buy position, our setup is set to the nearest swing low, while our stop loss is set to the nearest swing high when in a sell position. Here’s how it looks on the chart:
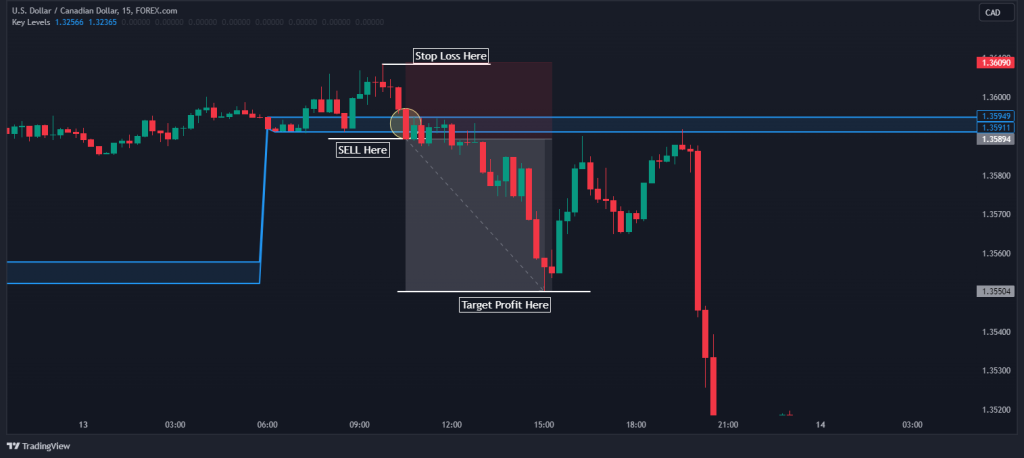
From the chart above, you can also notice that we set our target profit at two times the pip distance as the stop loss at a two-risk-reward target.
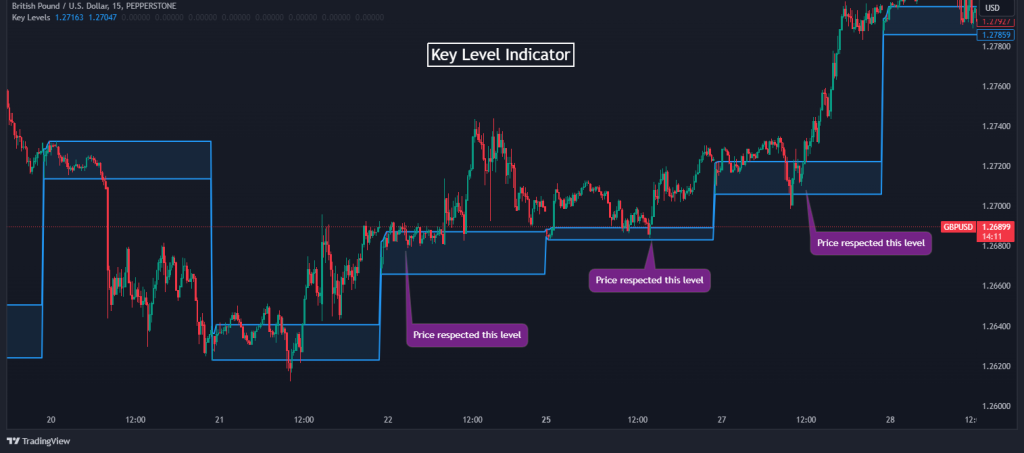
Keep in mind that the key level indicator can also be used for another strategy – that is, the range trading strategy. Assuming you’ve found support and resistance levels, you can use this range to buy at the key support level and sell at the resistance.
What are the Benefits and Limitations of the Key Level Indicator?
Here’s a full view of its pros and cons that you should be aware of so as to guide you in making informed decisions before diving deep into trading it:
Benefits of Key Levels Indicator
Key-level indicators in trading are particularly effective because they are based on psychological price levels on charts where a significant volume of trading activity occurs. Many traders with different trading styles base their technical analyses on these levels, making them crucial points for bullish or bearish entries and exits.
The high trading volume at these levels indicates their importance in the market. As part of the Smart Money Concept strategy, institutional traders also often make significant trades at these key levels, contributing to their resilience and lasting influence in the market.
Pros
- The key level indicator is easy to understand
- It offers insights into market momentum, and trading signals
- These key levels are where big-money moves happen, reinforcing their importance
- Horizontal key levels, in particular, have a lasting historical impact and remain active for extended periods
Limitations of Key Levels Indicator
Despite their benefits, key-level indicators have limitations. They are not infallible predictors of future market movements. For instance, one of the downsides of key levels is that they can shift over time, meaning that what once was a strong area of support or resistance may not hold in the future. As such, overreliance on key levels without considering overall market conditions can lead to overtrading or taking unjustified trades.
Another limitation of key-level indicators is the wide selection of those in the market. Unlike popular indicators such as the RSI and MACD indicators, there are many key-level indicators available on trading platforms, which means you must backtest it on a demo account before applying it in live markets.
Cons
- The key level indicator is not a built in indicator on most trading platforms
- They don’t always accurately predict future market actions
- Key levels can evolve over time, potentially losing their relevance
- Overdependence on key levels can lead to misjudged trading decisions
- They are most effective when used as part of a broader trading strategy
Key Takeaways
- Key levels in trading represent psychological price points where markets have shown repeated significant reactions, embodying collective trader behavior and pivotal moments of buying and selling.
- The Key Level Indicator simplifies the identification of these levels for traders, enhancing strategic trade planning by identifying zones of strong support or resistance and confirming movements for more reliable trading.
- They are integral to technical analysis due to the high volume of trading activity at these levels, offering insights into market momentum and being influenced by large institutional trades.
- The key level indicator is not infallible and can shift over time, necessitating a broader trading strategy and caution against overreliance to avoid misjudged trading decisions.enced traders.
Frequently Asked Questions About the Key Level Indicator
Here are some frequently asked questions about the Key Level Indicator:
Why are key levels integral to trading strategy?
Key levels offer pivotal entry and exit points, enhancing trade strategy by illuminating market psychology and elevating the likelihood of trade success. Ultimately, due to the herd behavior phenomenon in financial markets, properly identified key levels can bring significant gains for traders.
Are key levels sufficient for trading financial markets effectively?
While key levels shed light on potential market movements and can be used as a standalone trading strategy, they work better alongside other technical analysis tools, such as chart patterns and technical indicators. A robust trading strategy should integrate these insights with broader market analysis, including trends and volatility, for better decision-making.
Do key levels remain constant over time?
No, they don’t. Key levels evolve. Their relevance may diminish or shift; however, as this happens, new key levels tend to replace old ones.
Risk Disclosure: The information provided in this article is not intended to give financial advice, recommend investments, guarantee profits, or shield you from losses. Our content is only for informational purposes and to help you understand the risks and complexity of these markets by providing objective analysis. Before trading, carefully consider your experience, financial goals, and risk tolerance. Trading involves significant potential for financial loss and isn't suitable for everyone.