


The Ease of Movement (EOM or EVM) indicator measures the relationship between the price of a financial market instrument and its volume. With this unique insight into price and volume information, traders can predict the strength of trends, thus helping them make better trading decisions.
- The Ease of Movement indicator measures how the price of an asset moves in relation to volume.
- The farther away the price is from the indicator’s midpoint, the more “at ease” a trend is, and the likelier the chance that the trend continues.
- A trader can use the indicator in many ways, including divergences and zero-line crossovers.
- Most traders use this indicator in combination with other technical analysis tools. That is what we recommend.
In this piece, we’ll explore the important things you need to know about the Ease of Movement indicator and how to use it. Let’s dive in.
What is the Ease of Movement Indicator?
Developed by Richard W. Arms Jr., the Ease of Movement indicator is a momentum indicator that measures the relationship between the price of financial assets and the volume behind them. Essentially, the EOM indicator shows the volume required for a certain asset’s price to move.

Technically, this indicator is unique in that it doesn’t just try to measure the amount of volume backing a price movement, as a volume-based oscillator may do. Instead, it simply measures how easily the price of an asset is moving in an uptrend or a downtrend. If a trend is false, the EOM is the indicator you want to turn to to give you that information. At the same time, it is a valuable tool to assess the strength of a trend.
How the Ease of Movement Indicator Works
The Ease of Movement indicator has a positive and a negative side, separated by a zero-level midpoint. The EMV’s movement value on either side can sometimes stretch to as far as millions in value. So, the farther into the positive side the indicator is, the more “easily” a bullish trend is flowing. But the farther into the negative side, the indicator is, the more easily the bearish flow is.
However, if you see a trend that seems to be shooting off from a specific price point, but the EMV indicator is not rising with a vigor commensurate with the trend movement, it suggests that the price is not moving as easily as it should. There is likely low volume behind the movement, and you may expect a reversal.
That’s basically how the EOM works. But if you’re more technically inclined, here’s how to calculate the EOM:

Where:
Scale = any figure from 1000 to 100,000,000, depending on the average daily volume of the trading instrument
PL = Previous Low
PH = Previous High.
The “Distance Moved” helps us peg down the average distance moved by the price in a given period. It subtracts the midpoint of the previous period from the current midpoint. And “High” and “Low” are price levels from the most current period. This distance will be positive if the current midpoint is higher than the previous midpoint. However, it’ll be negative if the previous midpoint is higher.
The Box Ratio is determined from the volume and high-low range. This Box Ratio then becomes the denominator when for the calculation of the EMV for the current period. We then do this for a given number of periods and divide the sum by the number of periods to get our EMV indicator line.
How to Use the Ease of Movement Indicator
First, it is important to note that many traders prefer combining the EOM indicator with other technical indicators. However, that is not to say the indicator can’t give significant signals of its own. So here are some ways to use the EVM indicator:
Primarily, the indicator oscillates between positive and negative levels. However, unlike other indicators that define limit of values, the indicator value on the positive and negative sides can stretch to as far as millions on both sides of the midpoint (zero level), depending on the instrument you’re trading. This certainly makes the EOM indicator far more complex as you need to adjust it to a specific instrument.
Typically, the farther away from the midpoint (or zero level) the indicator is, the more “at ease” the trend is and the more it’s likely to continue. You don’t have to disturb yourself too much about how far away the indicator strays from its midpoint, though. What you can do, instead, is to try to catch zero-line crossovers with it. You simply buy when the indicator crosses the zero line to the upside, and you sell when the indicator crosses the zero line to the downside.
For those who find the zero-line crossover to give too many false signals, mark a level above the zero line from which you’ll take your bullish trades. This way, you wait for the break of that level on your indicator before you take your bullish trades. Conversely, you can mark a level below the zero area from which you can take bearish trades. This area will also vary, depending on your choice of trading instrument.
Another method of trading this tool is by catching divergences with it. A divergence occurs whenever the swing highs or lows of the price stray from those of the indicator.
One more way to use the indicator, and perhaps the way it was really intended to be used, is to measure the strength of a trend. The farther away the indicator is from the midpoint, the more “at ease” a trend is. If the movement of the EOM line isn’t commensurate with the price movement, this could be a sign that the trend is false, and the price may quickly reverse.
For instance, if the price falls faster than the EMV line is falling or the price is on the rise faster than the EMV is rising, the strength behind that move is questionable, and you may expect a reversal.
Ease of Movement Indicator Trading Strategy
Below, we will show different strategies to apply when using the Ease of Movement indicator:
Trading Divergences With the EOM
One of the simplest trading strategies using the EMV indicator is to trade divergences with it. This is possible because the indicator is an oscillator, and most oscillators can catch divergences. The EOM, for that matter, works the same as the RSI divergence and the MACD divergence.
The first thing you want to do is to know how to spot divergences on your chart. A bearish divergence is when the price forms a higher high while the EVM forms a lower high. It’s also a bearish divergence when the price forms a lower high while the indicator forms a higher high. In any of these two scenarios, you sell.
Your bullish divergence scenarios also form when the price gives a higher low while the indicator forms a lower low instead. Similarly, it’s also a bullish divergence when the price forms a lower low while the indicator forms a higher low. When any of the bullish scenarios pop up, buy.
Let’s see an example:
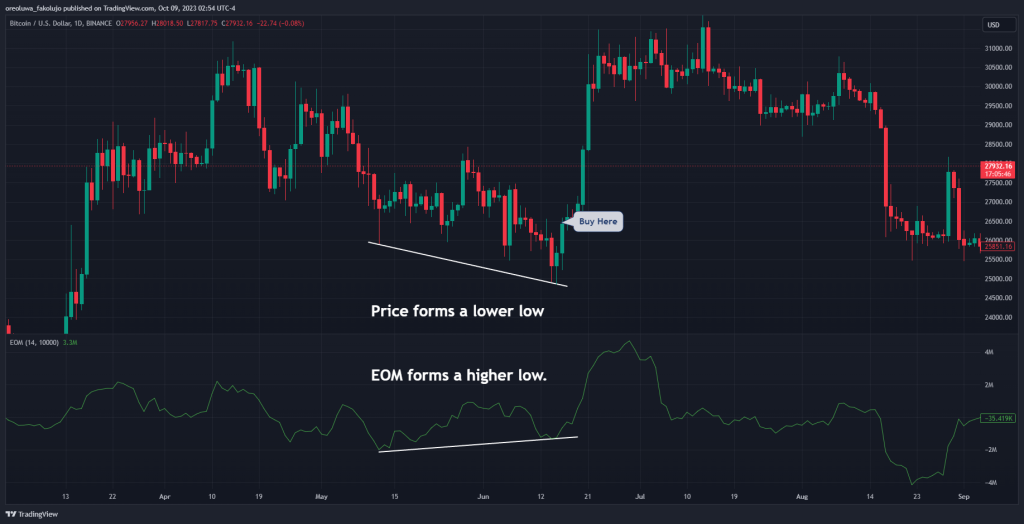
The price chart of BTCUSDT on the daily chart above offers a perfect example of how the EOM works as a divergence trading indicator. Notice how the price forms a lower low while the indicator forms a higher low. This is a bearish divergence situation, and the price responds just perfectly.
Trading Zero-line crossovers with the EOM
Another way to trade the EOM is to catch zero-line crossovers. However, when trading this strategy, you don’t want to rely on this indicator alone, as it is prone to many false signals.
Still, if you were to use it in isolation, you take your bullish signals when the indicator line crosses over the zero line. And conversely, you take your bearish signals when the indicator line crosses below the zero line.
Otherwise, you can combine the EOM indicator with moving averages or other indicators. In this strategy, for instance, we’ll use the 50-period Simple Moving Average as the trigger line to confirm signals. This way, you only enter positions when both the SMA and the EMV give off the same signals.
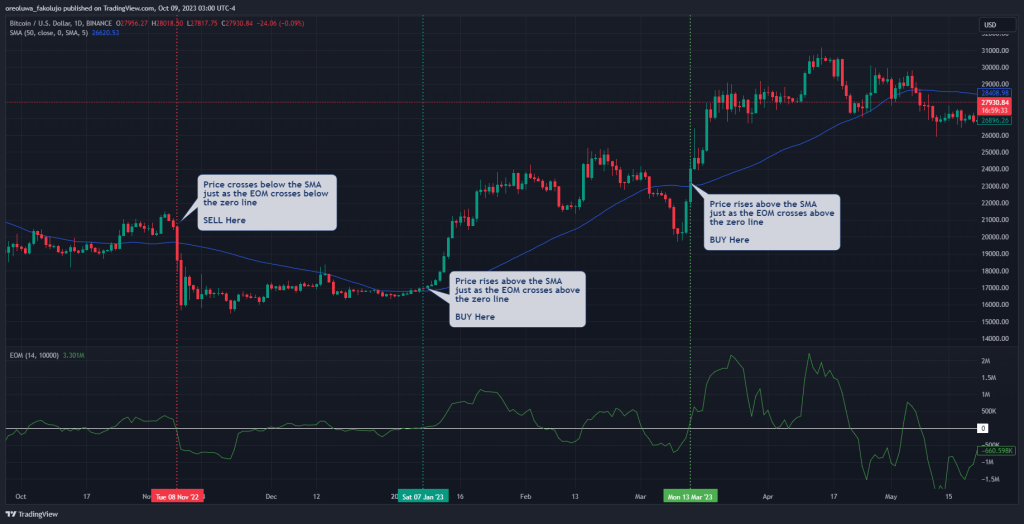
In the BTCUSD chart above, for instance, we only took crossover signals that correlated with the direction of the Simple Moving Average. In other words, we were bullish when the SMA line was below the price and the EMV line crossed above the midpoint. Also, we took bearish trades when the SMA line was above the price while the EMV crossed below the zero line.
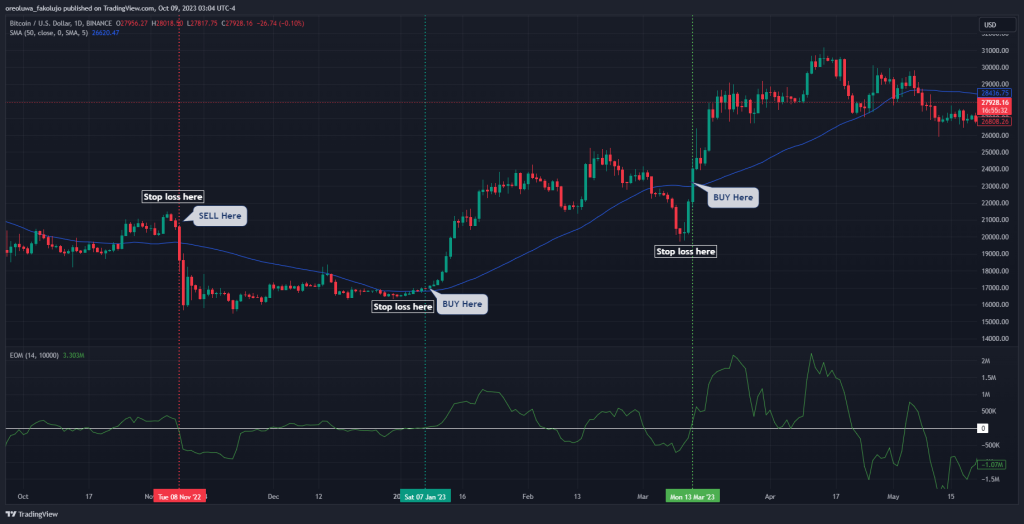
Setting Stop Losses and Take Profits
Regardless of the trading strategy you decide to go with, it’s best to place your stop loss below the most recent swing low if you’re taking a bullish trade. Also, place your stop loss above the most recent swing high when you take a bearish trade.
You can rely on a simple risk-to-reward ratio to catch your profit targets for your take-profit level. A 1:2 risk-to-reward ratio is generally recommended. However, this won’t always get you out of the trade on time. You could also wait for the indicator to give an opposite signal to your entered position.
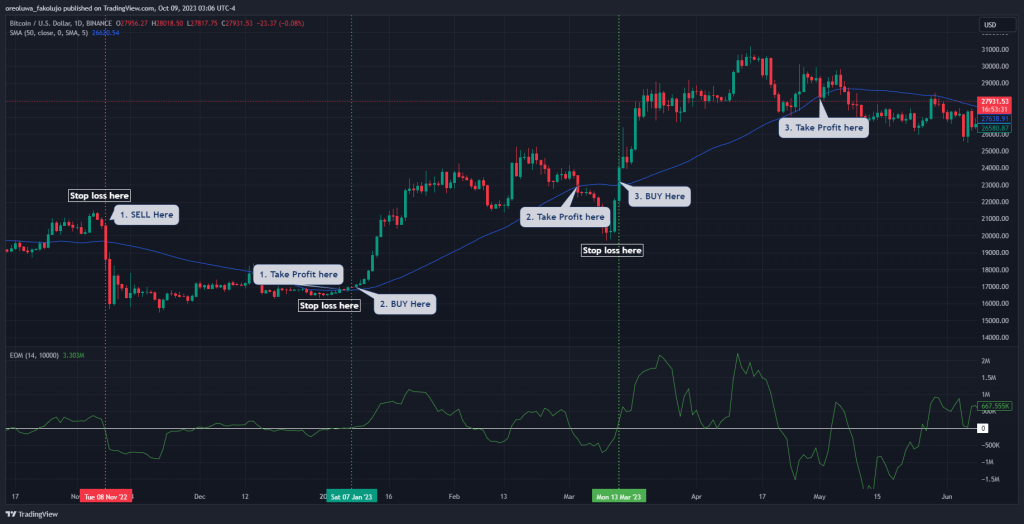
Finally, another way to exit trades is based on your simple moving average. Whenever the price crosses over and closes to a side opposing your entry position, exit that trade. For instance, exit bullish trades when the price crosses below the SMA. Similarly, exit bearish trades when the price rises above the SMA.
Ease of Movement Indicator – Pros and Cons
The Ease of Movement indicator has some advantages going for it. But it’s not without its potential disadvantages as well. We’re showing you both sides of this indicator so that you know what you’re working with if you decide to add it to your chart.
Benefits
One of the biggest advantages is its ease of use. Because it’s an oscillator that goes above and below an origin point, it’s easy to trade, even without understanding the idea behind it. Another reason this indicator stands out among the many indicators is that it can be an excellent tool for helping you survive most market conditions, including a choppy market, as the indicator remains pretty flat in those scenarios.
Here are some other benefits you can gain from using this indicator.
Pros
- It’s very easy to use and trade.
- It is excellent for measuring the strength (or ease) of a trend
- It can be an excellent tool for helping you survive a choppy market
Limitations
A significant disadvantage of the EOM is that it’s prone to many false trading signals, especially if you’re not combining it with other technical indicators. Also, the indicator is heavily lagging, so it isn’t quick in its sensitivity to recent price changes.
Cons
- It’s prone to a lot of false trading signals.
- You should combine it with other technical indicators or trading tools to get the best of it.
- It’s a lagging indicator.
Key Takeaways
- Developed by Richard Arms, the Ease of Movement indicator shows the relationship between volume and price volatility.
- With that relationship, traders can measure the true strength behind trends.
- The farther away the oscillator is from the midpoint, the more “at ease” a trend is, and the higher the chances that it continues. It simply shows there’s little resistance on the path of the trend.
- Because it’s an oscillator, you can trade divergences and zero-line crossovers with it.
- When trading crossovers with this indicator, the trader shouldn’t rely on the crossovers around the 0 level. Instead, they should mark a level above the midpoint from which they’ll take their bullish trades and a level below the midpoint from which they’ll take their bearish trades.
Frequently Asked Questions about the Ease of Movement Indicator
Here are answers to some of the most frequently asked questions about the EOM indicator:
What is the Ease of Movement index?
The Ease of Movement index is the handiwork of Richard Arms, who wanted to find a way to measure the strength of a trend by measuring the relative ease with which volume fuels a directional movement.
How do you interpret Ease of Movement?
The Ease of Movement consists of two sides on either side of a midpoint or a zero line. The upper side (positive side) measures the strength behind bullish trends, while the lower side (negative side) measures the strength behind bearish trends. The farther away the indicator line is from the midpoint, the stronger the trend.
How should the Ease of Movement Indicator be used?
There are many ways to use the Ease of movement (EOM) indicator. One way is to confirm trends with it. The farther the EOM line is into a negative or positive territory, the stronger the trend. Also, you can also catch divergences and zero-line crossover trades with it. Finally, you can always combine it with other technical analysis indicators.
Risk Disclosure: The information provided in this article is not intended to give financial advice, recommend investments, guarantee profits, or shield you from losses. Our content is only for informational purposes and to help you understand the risks and complexity of these markets by providing objective analysis. Before trading, carefully consider your experience, financial goals, and risk tolerance. Trading involves significant potential for financial loss and isn't suitable for everyone.


