Have you ever traded Japanese candlestick patterns? If not, you should consider adding them to your Forex toolkit. Candlestick chart patterns are a great way to enter and exit the currency markets with precision.
In this article, we will teach you how to recognize, interpret, and trade the tweezer top candlestick pattern. Read on for more information on this powerful technical analysis indicator.
 Table of Contents
What is the Tweezer Top Candlestick Pattern?
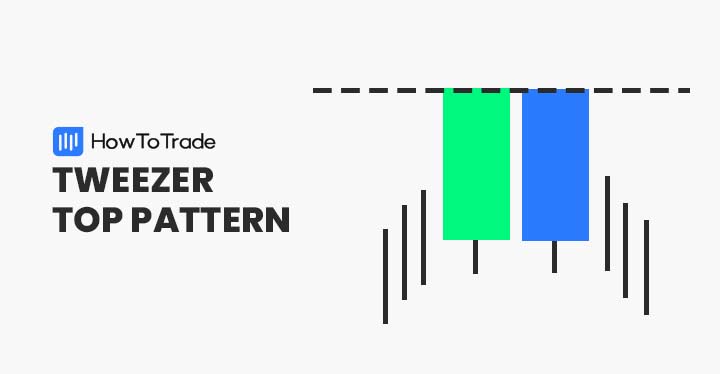
The tweezer top pattern is a bearish reversal pattern. It occurs in a bullish trend when the upper extremes of two candles arise at the same level, with the second candle being larger than the first one.
Forex traders view tweezer tops as potential selling opportunities. They are readily discernable on candlestick charts and can be an ideal way of shorting a currency pair.
How to Identify the Tweezer Top Pattern in Trading?
The tweezer top formation is a user-friendly, intuitive trading signal. The pattern appears amid a formidable uptrend and suggests a price-action reversal.
Much like other classical chart patterns, trading the formation has three steps: identifying an uptrend, locating the tweezer patterns, and interpreting the candlestick pattern. The GBP/USD chart below gives us a good look at the tweezer top.
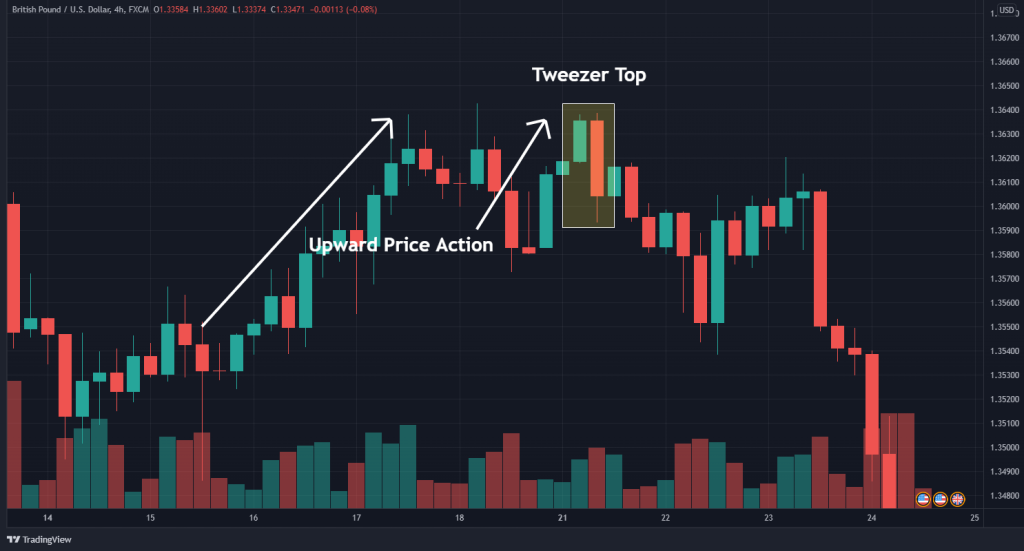
Here is how to use the formation:
- Locate an upward trend in price
- Recognize two tweezer candlestick patterns near the top of the uptrend
- Begin looking for a bearish market entry point
- Sell the market
Identify An Uptrend
By definition, the tweezer top pattern is a bearish reversal indicator. Thus, the pattern appears after a bullish move in price. The first step in applying bearish tweezer patterns is to locate a formidable upward movement in price action.
Accordingly, the tweezer top may be used to trade bearish reversals or join prevailing bearish trends.
Recognize The Bearish Tweezer Top Pattern
Spotting the tweezer top in the live market is straightforward. The pattern consists of the following characteristics:
- Develops following an upward move in price.
- Two consecutive candles that have approximately the same highs.
- The first candle is a bullish candlestick.
- The second candle is a bearish candlestick.
Interpretation
Essentially, tweezer tops signal forthcoming downward price action. The pattern suggests that opening a short position is appropriate. This may be done in two ways:
- Taking a short against an uptrend in anticipation of market reversal.
- Opening a short position on a market pullback with an established bearish trend.
In either instance, tweezer tops are used to sell FX currency pairs, CFDs, shares, or indices.
How To Trade the Tweezer Top Pattern?
Most trend reversal patterns are traded in adherence to a straightforward process. The tweezer top is no different.
All you need to do is define your market entry point, locate stop losses, and set profit targets. After that, trade execution is routine.
1. Market Entry
Tweezer tops are bearish reversal indicators. So, the pattern suggests that selling the market may be appropriate.
To enter the market, place a sell order beneath the second candle of the series. Upon the sell order being filled, a new short position will be opened in the market.
2. Stop Loss
The second step in trading tweezer tops is to locate your stop loss. Remember, this formation is a signal of forthcoming bearish price action. Thus, your stop loss should be placed above the pattern itself.
To place a stop loss, locate your stop-out point above the upper extreme of the pattern. This will be a buy order that cancels the active short position.
3. Profit Target
With the tweezer top, profit targets are set beneath the formation. This is done to capture the downward price action.
In forex, there are many ways to set profit levels. Risk vs. reward ratios of 1:1, 1:2, 1:3, 1:4, and 1:5 are among the most common. Also, technical indicators or support and resistance levels can be helpful. The choice is yours!
Trading Example
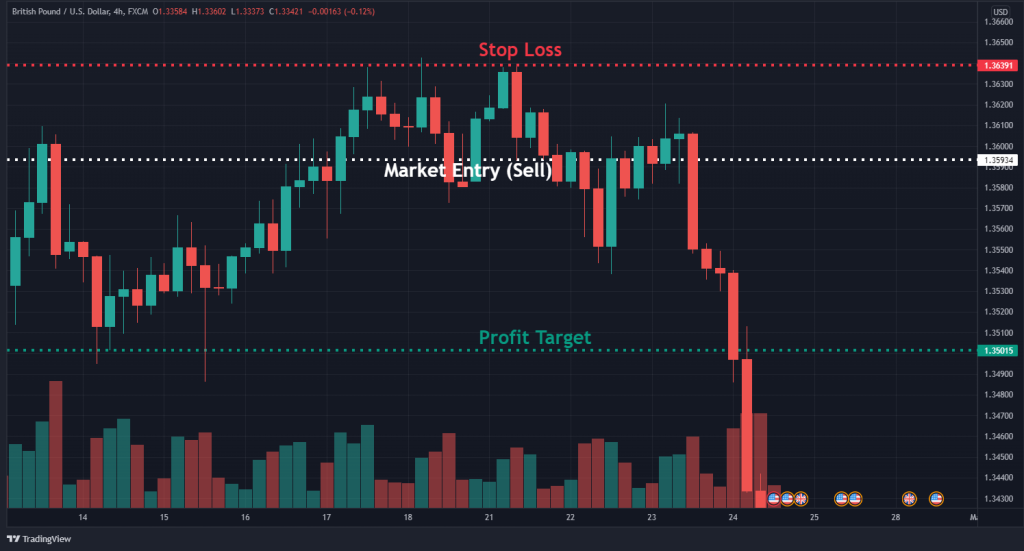
The GBP/USD price chart below gives us a good look at how to trade the tweezer top pattern.
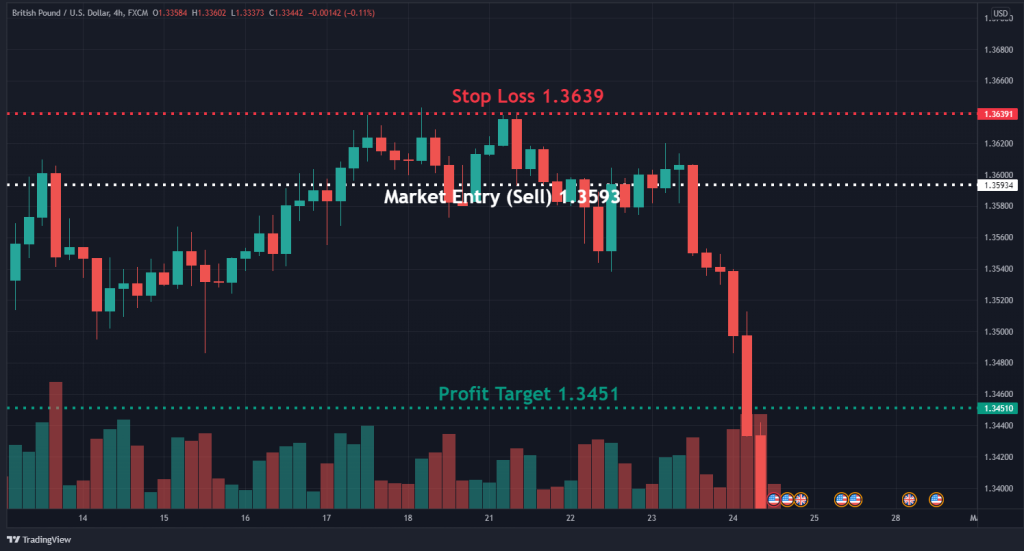
This tweezer top trade was executed as follows:
- The pattern was identified.
- A sell order was placed beneath the second candle at 1.3592.
- A stop-loss was located above the pattern’s top at 1.3639.
- A profit target was set at 1.3451, according to a 1:3 risk vs. reward ratio.
- A 141 pip gain was realized upon the profit target being hit.
The Tweezer Top Vs. The Tweezer Bottom Pattern
Although both the tweezer top and tweezer bottom are variations of a reversal pattern, there are some key differences. Below are a few of the most important:
- A tweezer top is a bearish reversal pattern. It signals a selling opportunity.
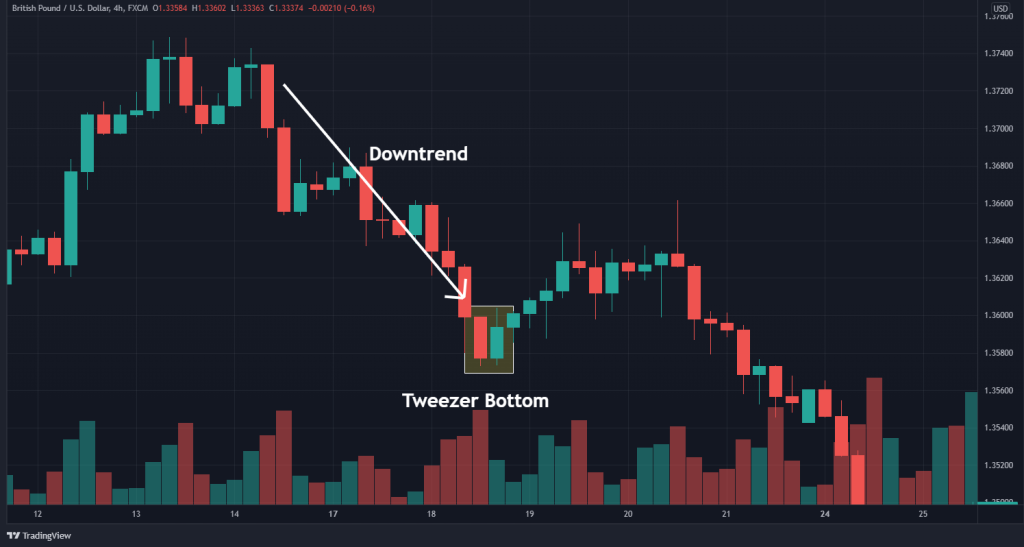
- A tweezer bottom pattern is a bullish reversal pattern. It signals a buying opportunity.
- A traditional bullish candle completes the bullish tweezer.
- A definitive bearish candle completes the bearish tweezer.
In either form, tweezers are used to project and trade market reversals.
The Tweezer Top Pattern — Pros and Cons
Similar to all other technical indicators, tweezer tops have a distinct collection of pros and cons. Listed are a few of the most prominent.
Pros
- Readily identifiable and easily recognizable
- Form frequently in all forex pairs and time frames
- Works well with other indicators
Cons
- Can be expensive to trade on more extensive time frame charts
- May produce false signals when faced with solid trends
- Limited utility when applied in isolation
Key Takeaways
In conclusion, here are the key takeaways about trading the tweezer top pattern.
 Key Takeaways
- The tweezer top pattern is a two candle formation. It is classified as a bearish reversal chart pattern.
- Trading the tweezer top is simple. To execute a trade, place a sell order beneath the second candle, a stop loss above the pattern’s high, and a profit target under the entry point.
- Tweezer tops show limited effectiveness when used alone and in highly volatile environments.
Frequently Asked Questions (FAQs)
Below are a few of the most frequently asked questions regarding the tweezer top pattern.
Is the tweezer top a bullish reversal pattern?
No. It develops during an uptrend and signals a forthcoming downtick in price.
Which indicators work well with tweezer tops?
Many technical tools complement the pattern. A few of the most common are oscillators, moving averages, and pivot points.
How effective is the tweezer top in predicting trend reversals?
No chart pattern is 100% effective. Although tweezer tops signal bearish reversals, it’s best to use them with other technical indicators to confirm the reversal.
Risk Disclosure: The information provided in this article is not intended to give financial advice, recommend investments, guarantee profits, or shield you from losses. Our content is only for informational purposes and to help you understand the risks and complexity of these markets by providing objective analysis. Before trading, carefully consider your experience, financial goals, and risk tolerance. Trading involves significant potential for financial loss and isn't suitable for everyone.


