Are you familiar with harmonic patterns? How about the three drives pattern? In this article, we’ll teach you how to identify, interpret, and trade this powerful technical indicator.
- What Is The Three Drives Pattern?
- How To Identify And Use The Three Drives Reversal Pattern In Trading
- How To Trade The Three Drives Formation?
- Another Trading Example
- Three Drives Harmonic Pattern – Pros and Cons
- How is the Three Drives Pattern Different from the ABCD Pattern?
- Three Drives Pattern (VIDEO)
- Key Takeaways
- Frequently Asked Questions
What Is The Three Drives Pattern?
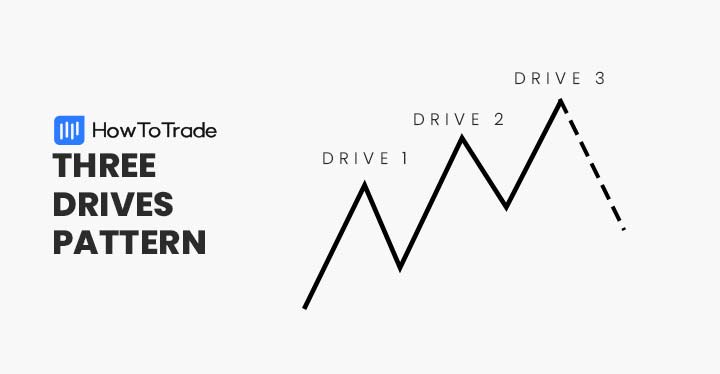
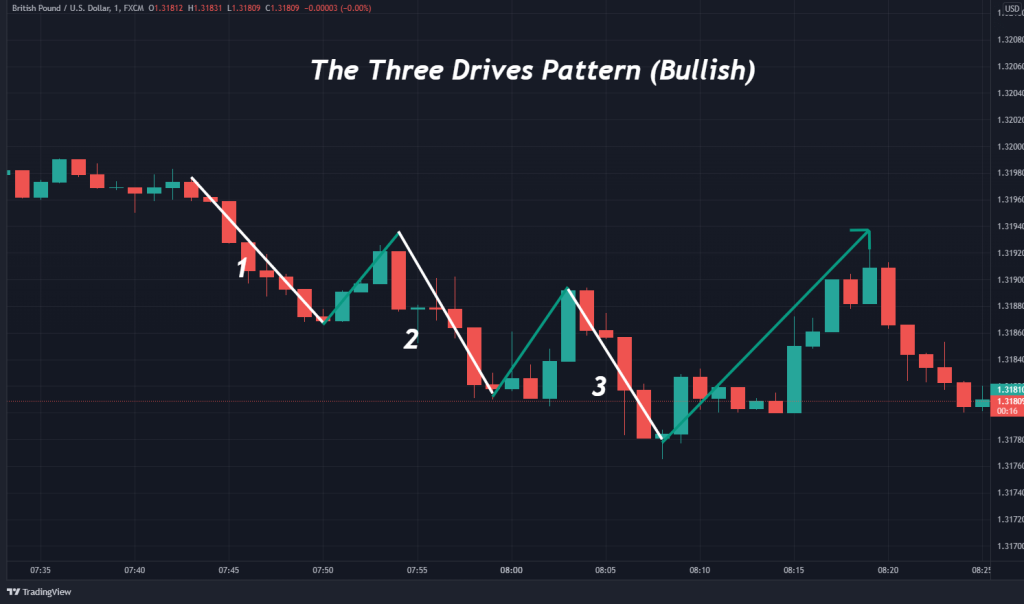
The three-drives chart pattern is a harmonic formation of three consecutive symmetrical price movements in one direction, ultimately leading to a reversal. It is classified as a harmonic reversal pattern and comes in two forms: bullish and bearish.
The bullish three-drive pattern is formed by three distinctive price movements to the downside, leading to a bullish reversal. A bearish three-drives pattern is formed by three strong pushes to the upside, followed by a bearish reversal.
Currency traders use the three drives to identify potential reversal zones in the live forex market. Upon doing so, it becomes possible to enter the market to the long (buy) or short (sell).
How To Identify The Three Drives Reversal Pattern In Trading
Like other harmonic patterns, identifying and constructing the three-drives pattern is a multi-step process. Nonetheless, it’s a powerful reversal pattern and one that can improve your profitability when trading forex.
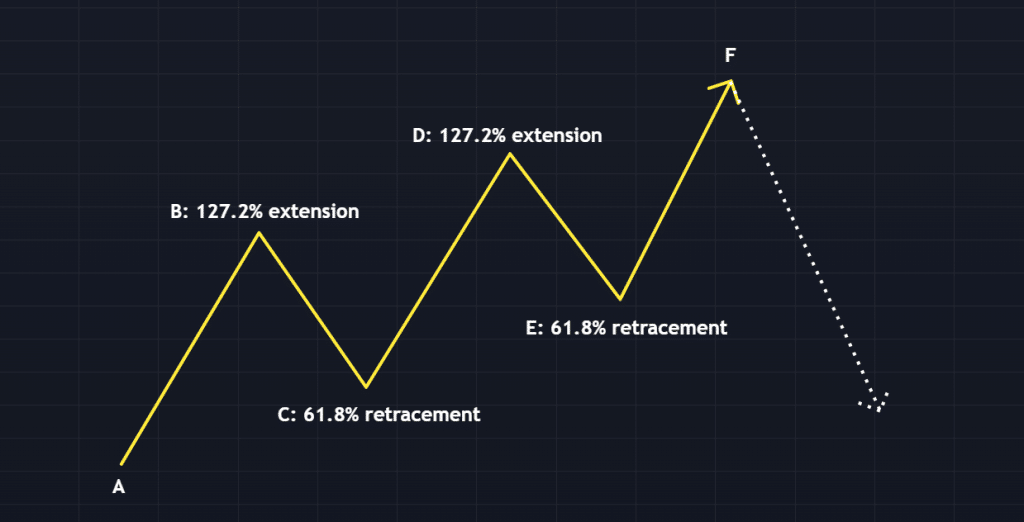
To help you identify the three drives, you need to understand some key concepts like swing points and the Fibonacci extensions/retracements.
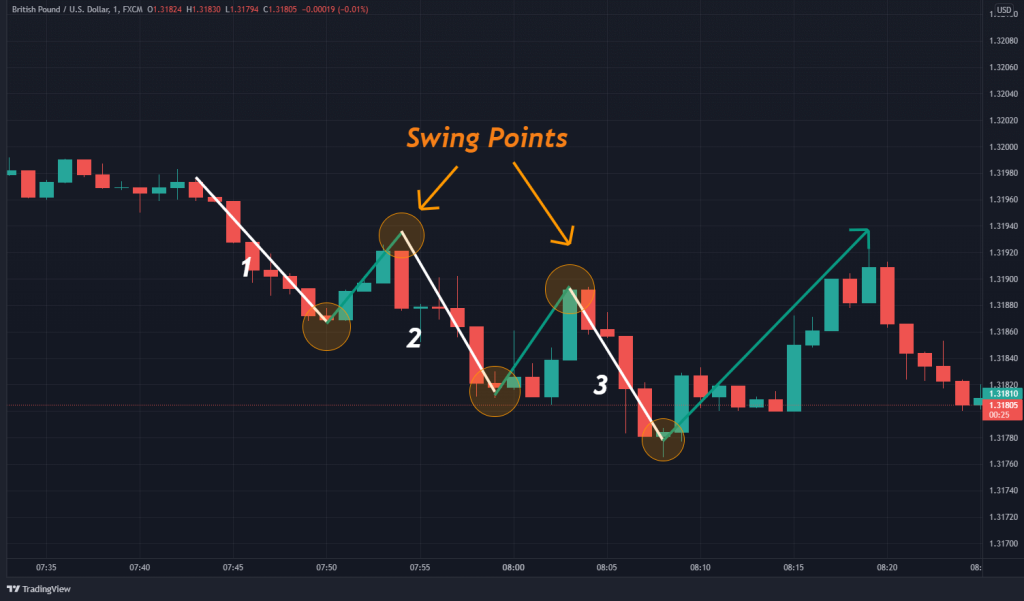
1. Previously Formed Swing Point
One of the critical parts of constructing a valid three drives is identifying a previously formed swing point. A swing point is where the price pivots from the existing trend.
Swing points are vital elements of the three drives pattern. They serve as the price point from which Fibonacci extensions and retracements are applied. Below is an illustration of a swing point.
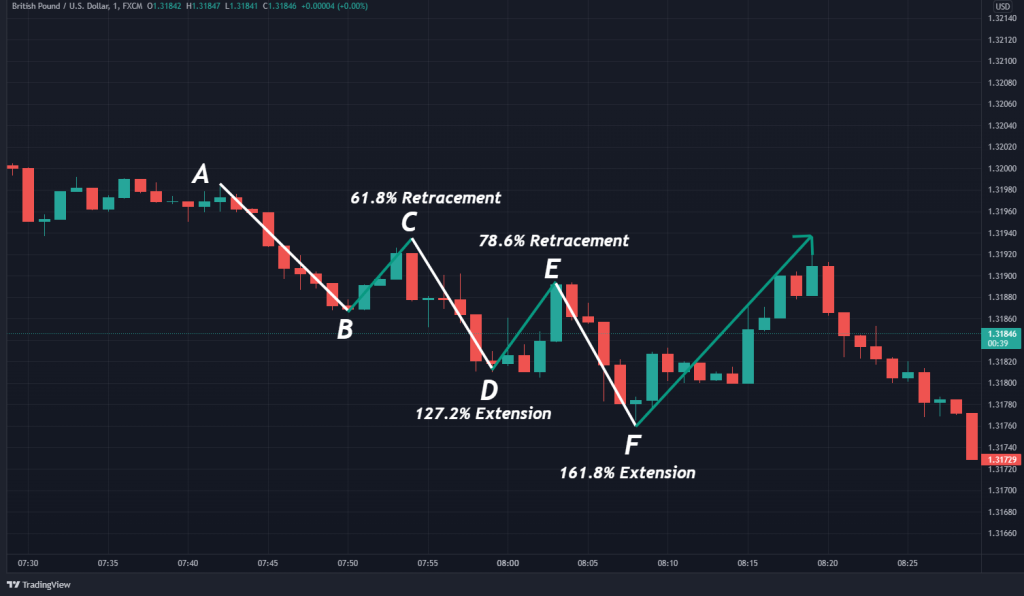
2. Fibonacci Extensions & Retracements
When identifying the three drives pattern, symmetry of price action is important. To establish this symmetry, Fibonacci extensions or retracements may be used. The following are how each may be applied to build the three drives formation:
- Fibonacci Extension: The last two drives, C-D and E-F, should represent between 127.2% and 161.8% of the B-C and D-E pullbacks, respectively.
- Fibonacci Retracement: The B-C and D-E pullbacks represent between 61.8% and 78.6% retracements of the preceding drives A-B and C-D.
Below is a breakdown of the process used to identify and trade this harmonic pattern:
- Identify the prevailing bullish or bearish trend.
- Label the three consecutive directional price movements as 1, 2, and 3.
- Confirm the pattern by using Fibonacci extensions or retracements.
- Upon the third and final drive being completed, establish a market entry. This will exist as either a bullish or bearish reversal.
There is a school of thought that asserts that the three movements leading to the reversal must have some form of time symmetry to them. In other words, each drive to the upside or downside should happen in about the same duration of time. Others say it’s not necessary. We recommend you consider both. See the one with time symmetry as the “perfect” three drives pattern and the one without time symmetry as the “imperfect but allowable” three drives pattern. Then you can allot risk accordingly, with the imperfect one having less risk.
Do this until you have backtesting or forward testing data of what works best for you.
How To Trade The Three Drives Formation?
All classical, harmonic, and single-candlestick patterns have a specific procedure for being traded. It is a three-pronged approach that includes determining market entry, setting a stop loss, and locating a profit target.
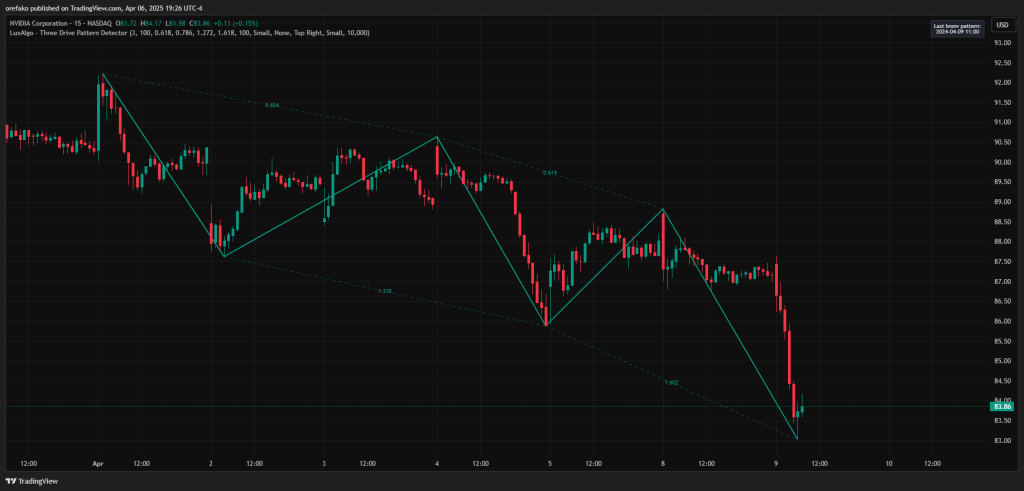
We’ll show you an example of how to trade it using the NVIDIA stock chart on the 15-minute timeframe.
1. Trade Setup
The first step is to identify the pattern on your chart. For this example, we used the LuxAlgo Three Drive Pattern Detector on TradingView to spot the pattern. It is free, so you can easily place it on your chart and it’ll spot any potential three drives on your chart.
On our NVIDIA chart, we have a bullish three-drive pattern forming.
Once the pattern has been formed, we start to look for entry setups.
2. Market Entry
The three-drive formation is a reversal indicator that occurs in both uptrends and downtrends. Thus, the pattern may act as either a bullish reversal (buy) or a bearish reversal (sell) signal. In our NVIDIA example, the pattern is expected to give a bullish reversal.
The entry point is the bottom of the third drive for a bullish three-drive pattern. And according to the rules, this bottom should be at the 1671.8 extension of the most recent retracement. The third drive drove past this level on our NVIDIA example, but quickly recovered.
One way to enter is to place the limit order on the 161.8 extension in anticipation of the reversal. You can also look for reversal patterns around this level as confirmation before entering. In our trading example, we begin to see the formation of an internal bullish market structure of higher highs and higher lows. We take this as a signal that the reversal has begun.
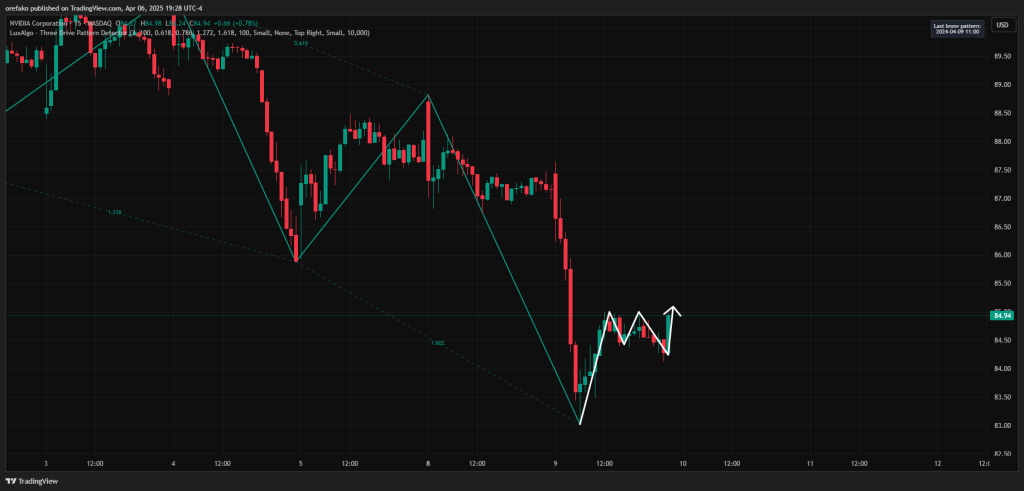
This is our entry.
2. Stop-loss
Locating a stop loss with harmonic chart patterns relies on building out the proper legs of the formation. For instance, in the case of the bearish three drives, the progression is an upward move and then a lower retracement. So, the stop loss is located above the formation.
In the case of a bullish three-drive pattern, the stop loss is placed beneath the lower extreme established by the third drive.
3. Profit Targets
Forex traders use a collection of techniques to set their profit targets. A few of the most common are risk vs. reward ratios, pattern height, or Fibonacci extensions.
With the three-drive formation, the ideal profit target is the 0.618 retracement level of the entire pattern range. You can also place it at the top of your third drive, in a bullish scenario, and just below in a bearish scenario.
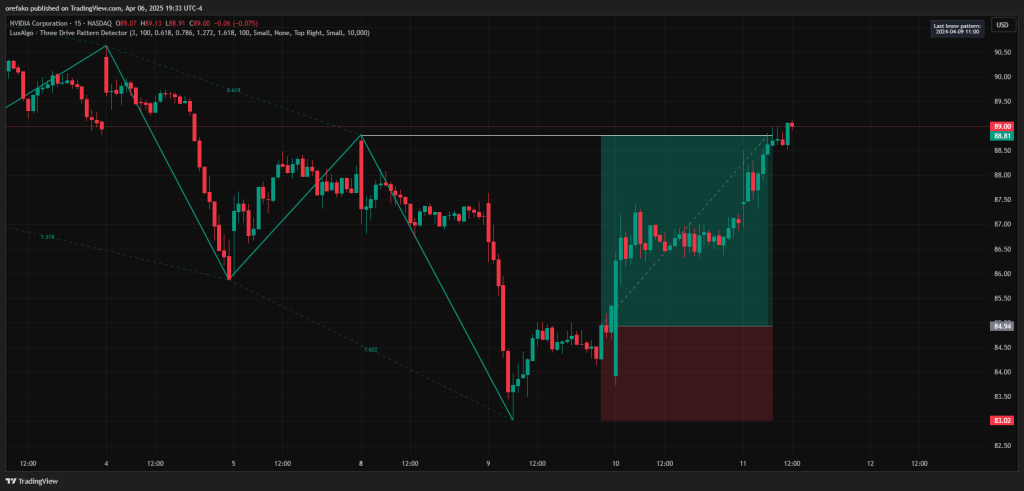
Of course, you can let the price run if you have reasons to believe it is going to make a deeper reversal. It’s up to you where you place your profit targets. Factors to consider include market volatility, strategy, and the time frame being traded.
Another Trading Example
The GBP/USD chart below provides another clear look at how to determine the precise entry point, set stop losses, and align profit targets.
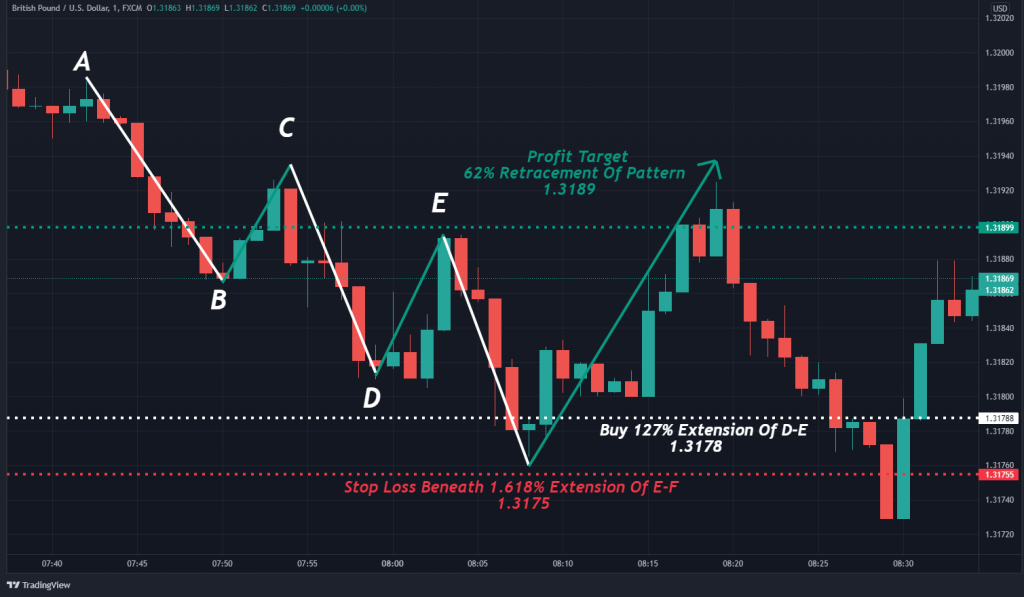
Here’s how the GBP/USD trade above was executed:
- A pronounced downtrend was observed on a 1-minute GBP/USD chart.
- The three drive pattern was constructed.
- A buy order at 1.3178 was executed.
- Stop-loss was placed beneath the pattern at 1.3175.
- A profit target was located at 1.3189 at the pattern’s 62% retracement.
- An 11-pip gain was realized upon price reaching the profit target.
Three Drives Harmonic Patterns – Pros and Cons
Every strategy, system, or analytical base has a set of pros and cons. Below are a few of the most relevant for the three drives chart pattern.
Pros
- User-friendly and easy to recognize
- Can generate large profits when effective
- Offers the trader a concrete stop out point
Cons
- It doesn’t frequently occur in all forex pairs
- It is expensive to trade on more extensive duration price charts
- Loses efficacy on compressed time frames
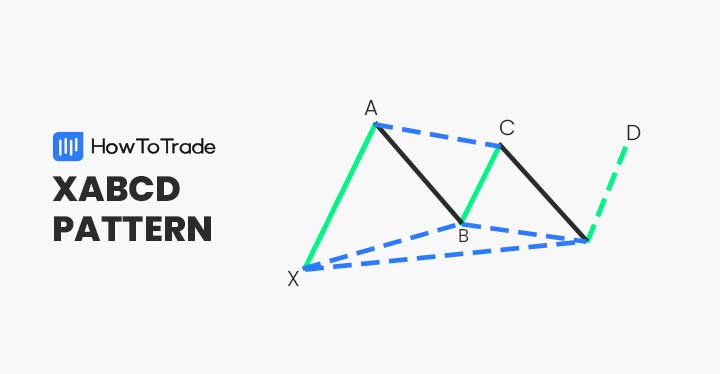
How is the Three Drives Pattern Different from the ABCD Pattern?
The Three Drives pattern and the ABCD pattern are harmonic trading patterns that help traders identify potential reversal points, but they have some key differences.
For instance, the ABCD pattern has 4 points (A, B, C, D) and two legs (AB and CD) with a corrective move in between (BC). The AB and CD legs are usually equal in length and time, making it a symmetrical pattern. The Three Drives pattern, on the other hand, has 6 points and three consecutive impulse waves (Drives 1, 2, and 3), each followed by a corrective move.
Another major difference between these two is that the ABCD is easier to spot and trade, especially for beginner traders. The three drives pattern, though, is not the most beginner-friendly trading pattern out there.
The Gartley Harmonic pattern is also similar to the three-drives pattern. However, it is just as similar as the ABCD, and they all share the same differences.
Everything About the Three Drives Pattern in One Video
Check this video for more information on how to trade the 3 drives pattern.
Key Takeaways
Below, we have summarized the main findings of three drives harmonic patterns:
- The three drives formation is a harmonic chart pattern. It consists of three consecutive moves in price, which each follow a measured retracement.
- Three drives patterns are leading reversal indicators. They furnish traders with counter-trend buy and sell signals. The bullish three drives occur during a downtrend; a bearish three drives develop during an uptrend.
- Fibonacci retracements and extensions are used to confirm the pattern’s symmetrical price movements.
Risk Disclosure: The information provided in this article is not intended to give financial advice, recommend investments, guarantee profits, or shield you from losses. Our content is only for informational purposes and to help you understand the risks and complexity of these markets by providing objective analysis. Before trading, carefully consider your experience, financial goals, and risk tolerance. Trading involves significant potential for financial loss and isn't suitable for everyone.