Have you heard of the three black crows candlestick pattern? If not, read on to learn more about how this formation can help you profit from financial market volatility.
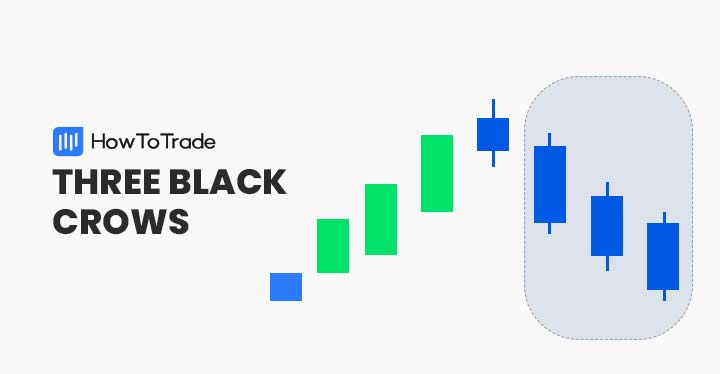
The three black crows chart formation (3 black crows) is a bearish reversal pattern. It consists of three consecutive bearish candles that form within an uptrend.
 Table of Contents
- What is the three black crows pattern?
- How to identify and use the the three black crows?
- How to trade the three black crows pattern?
- Trading example
- Three black crows vs. three white soldiers
- The three black crows pattern – Pros and cons
- Three black crows pattern (VIDEO)
- Key takeaways
- Frequently Asked Questions (FAQs)
What is the Three Black Crows Pattern?
The three black crows chart pattern is a bearish reversal candlestick pattern. It consists of three consecutive, relatively long bearish candlesticks that occur during an uptrend.
Three black crows may be commonly found in the CFD markets.
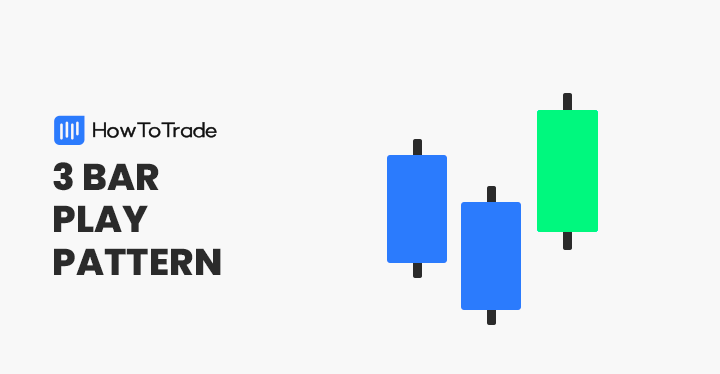
Financial market traders view three black crows as a potential shorting signal much like the bearish 3 bar play pattern. Thus, the pattern may be readily incorporated into bullish trend reversal trading strategies.
How to Identify and Use Three Black Crows?
Identifying three black crows chart patterns is relatively simple. All you need to do is spot an uptrend and three long-bodied bearish candlesticks in a row.
The GBP/USD chart below gives us a great look at the 3 black crows candlestick pattern.
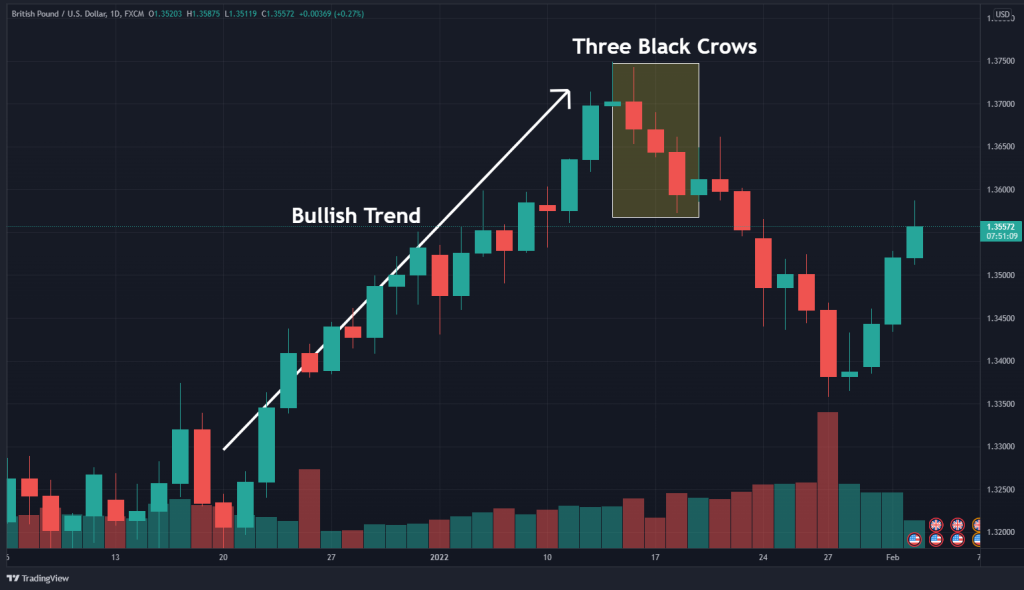
Follow these steps to identify and trade three black crows:
- Recognize an uptrend in price
- Locate three consecutive bearish candles
- Qualify each candle’s short upper shadow and low close relative to the previous candle
- Look to sell beneath the pattern
Three Bearish Candles
At its core, three black crows is a bearish candlestick pattern. To be valid, you must have three consecutive bearish long candlesticks. If there aren’t three, it isn’t a black crows candle pattern.
Short Upper Shadows
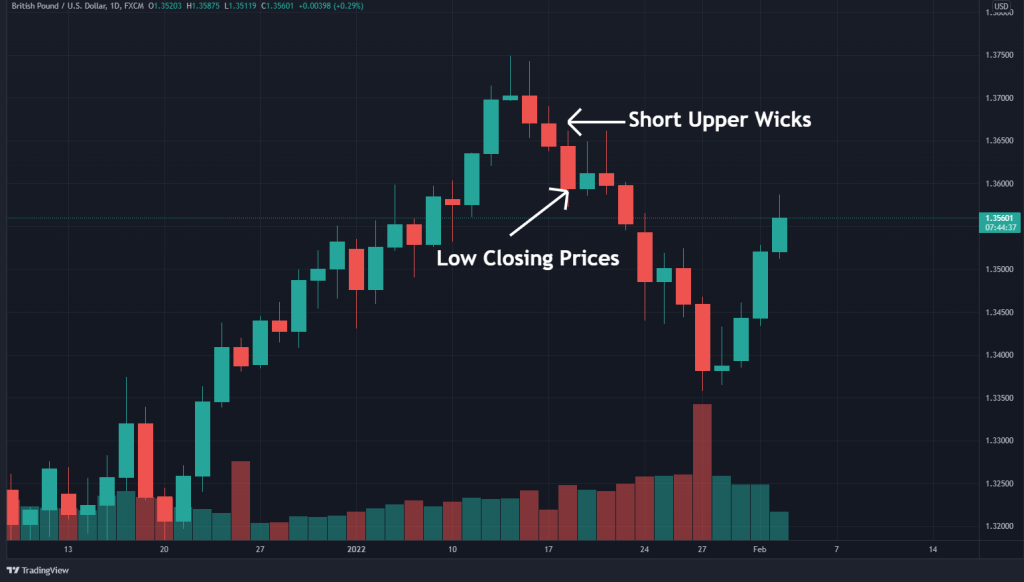
It isn’t enough to have three negative candle’s in a row during an uptrend. For the black crows pattern to be relevant, their upper shadows must be moderately sized.
Of course, there is no exact length parameter that the upper shadows need to meet. However, their length should be less than or equal to the candle’s body.
Low Closing Price
As a general rule, the closing price of each negative candle should be in the lower quadrant. The low close suggests that the periodic sentiment was bearish.
How to Trade the Three Black Crows Candlestick Pattern?
As with all reversal patterns, three black crows signal countertrend trades. To trade the pattern, identify the market entry, stop loss, and profit target locations.
Market Entry
The three black crows chart pattern suggests that a potential shorting opportunity may be in the offing. To short the market using the pattern, enter a sell order beneath the low of the third candle. Once the order is executed at the market, a new short position will become active.
Stop Loss
Risk management on the three black crows can go in various locations. One way is to place a stop above the top of the pattern, above the high of the first candle. Another method is to place the stop loss immediately above the third candle’s high.
Profit Targets
Profit targets may be set in a number of locations. Commonly, profits are taken in adherence to an acceptable risk vs. reward ratio. A few of the more common ratios used in the markets trading are 1:1, 1:2, 1:3, and 1:4.
The three black crows pattern is a reversal indicator; thus, more prominent risk/reward ratios are feasible.
Example: Bearish Reversal Pattern in the GBP/USD
The three black crows pattern exclusively identifies selling opportunities in the market. Check out the GBP/USD example below for a real-world tutorial on trading this chart formation.
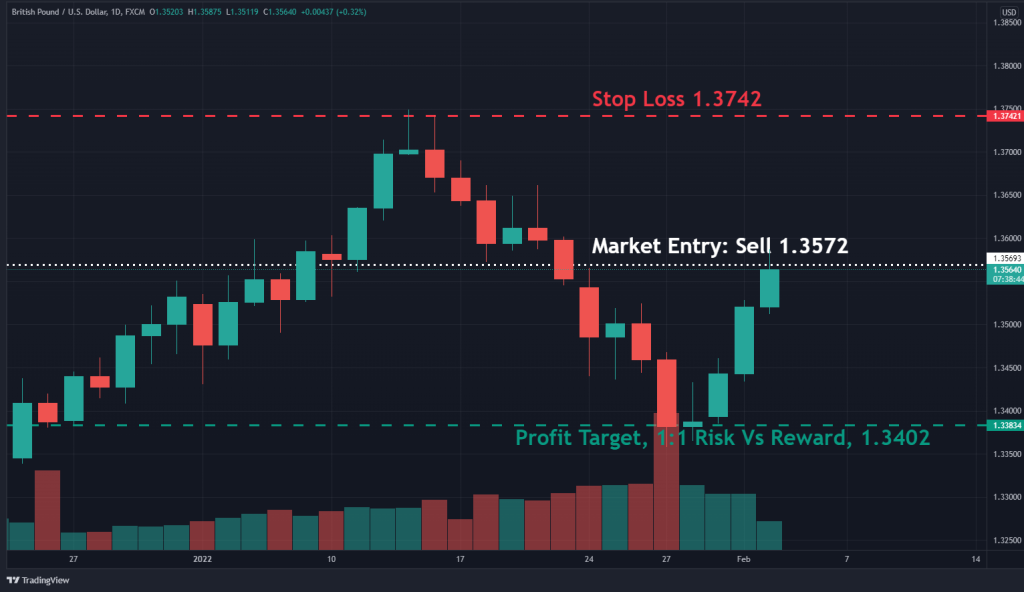
The GBP/USD short trade above was executed as follows:
- The pattern was identified within the prevailing uptrend
- A sell order was placed beneath the third candle at 1.3572.
- A stop-loss order was placed above the pattern at 1.3742.
- The profit target was 1.3402, using a 1:1 risk vs. reward ratio.
- The profit target hit, generating 170 pips profit.
Three Black Crows vs. Three White Soldiers
The three black crows and three white soldiers chart patterns differ in several important ways:
- Three black crows consist of three successive bearish candles, while three white soldiers are three consecutive bullish candles.
- The three black crows formation is a bearish reversal pattern. It forms during an uptrend and signals a selling opportunity.
- The three white soldiers formation is a bullish reversal pattern. It forms during a downtrend and signals a buying opportunity.

Three Black Crows Pattern – Pros and Cons
All Japanese candlestick chart patterns have a distinct collection of pros and cons. Below are a few of the most important for the three black crows pattern.
Pros
- Easy to identify and trade
- Occurs frequently on all forex pairs, commodities, and shares
- Ideal for trading reversals and entering new trends
Cons
- May produce false signals in consolidating market conditions
- Daily, weekly, and monthly timeframes can be expensive to trade
- Can set up a late market entry
Everything About the Three Black Crows Pattern in One Video
Watch this video to learn how to identify and trade the 3 black crows pattern with real-time examples.
Key Takeaways
Here are the key takeaways you need to consider when using the three black crows pattern.
 Key Takeaways
- The three black crows chart pattern is a bearish reversal indicator. It consists of three negative candles that form during an uptrend.
- The formation is used to identify selling opportunities in currency pairs.
- To trade, a sell order is placed beneath the third candle of the pattern; the stop loss is placed above the pattern, with profit targets located below.
- Three black crows frequently form in all markets on all time frames.
Risk Disclosure: The information provided in this article is not intended to give financial advice, recommend investments, guarantee profits, or shield you from losses. Our content is only for informational purposes and to help you understand the risks and complexity of these markets by providing objective analysis. Before trading, carefully consider your experience, financial goals, and risk tolerance. Trading involves significant potential for financial loss and isn't suitable for everyone.


