- The 20 EMA strategy emphasizes recent price data to identify market trends, providing traders with signals for potential buy and sell opportunities in various markets.
- Unlike a simple moving average, the 20 EMA responds more swiftly to price changes, making it effective for identifying trend directions and potential entry and exit points.
- Traders use the 20 EMA to gauge market trends; prices above the EMA suggest an uptrend and potential buying opportunities, while prices below indicate a downtrend and selling signals.
Among technical indicators such as the volume profile indicator, stochastic RSI, and the rest, moving average indicators are the most popular, and for good reasons: they seem to be accurate and profitable for traders. And a very popular strategy is the 20 Exponential Moving Average strategy.
In this article, we will introduce you to the 20 EMA strategy, showing you everything from how to set it up to explain how to place a trade with it. If you’re looking to learn more about the EMA trading strategy, read on.
 Table of Contents
What is the 20 EMA Strategy?
The 20 EMA strategy is particularly valued for its focus on recent data points, which gives it an edge in identifying market trends and movements. This strategy, by utilizing a 20-day EMA, helps traders generate buy and sell trades with an aim to trade short-term price swings in various securities profitably. Due to its simplicity and effectiveness, you’ll always find professional traders who use this strategy in a wide range of markets, including forex trading, stocks, and commodities.
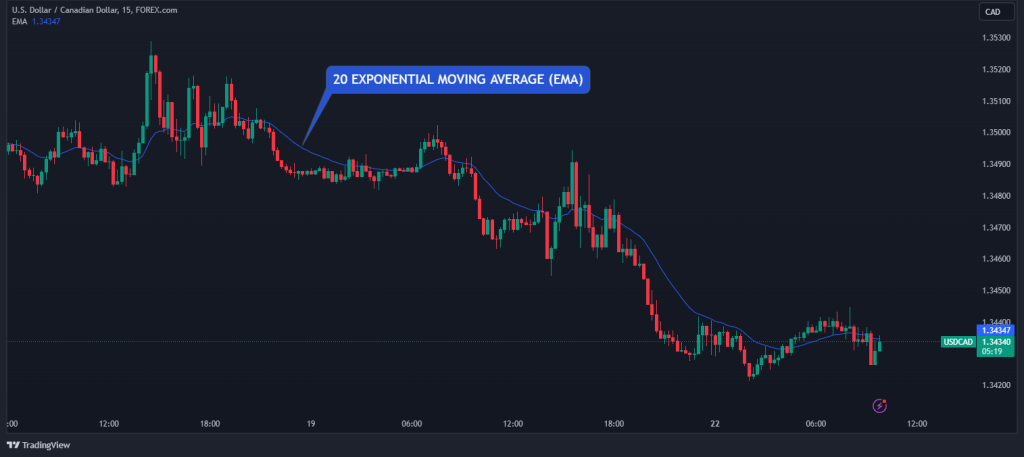
The 20 EMA is calculated by averaging the asset’s prices over the past 20 trading days, with a greater emphasis on its exponential moving averages placed on the most recent prices. This results in the EMA responding more rapidly to price changes compared to a simple moving average (SMA). So, if you are looking to identify trend directions and potential entry and exit points swiftly, the 20 EMA is your best bet.
There are a lot of ways to use the 20 EMA (and we’re going to get into that in a moment). However, perhaps the most common strategy involves observing the price’s relation to the 20 EMA to determine the market trend. For instance, a price persistently above the 20 EMA may indicate an uptrend, suggesting a buying opportunity, while a price consistently below it may signal a downtrend, hinting at a potential selling point. The idea is simple and works the same as many other EMA strategies, including the popular 9 EMA trading strategy.
Check our video tutorial on how to use the 20 EMA trading strategy:
The 20 EMA Strategy – Trading Setup
Setting up the 20 EMA indicator on trading platforms like TradingView, MetaTrader 4 (MT4), or MetaTrader 5 (MT5) is a straightforward process that can significantly enhance your trading strategy. Let’s quickly walk you through how to do that in a jiffy!
For TradingView Users
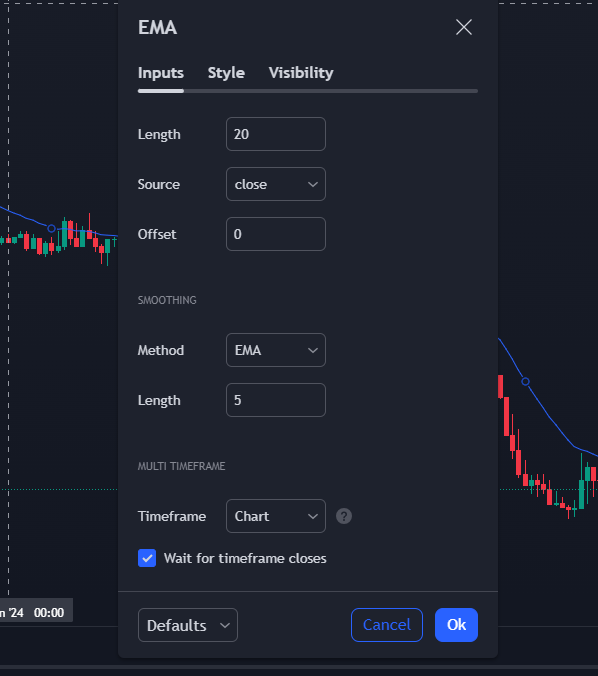
On the TradingView platform, the EMA is a built-in indicator that can be easily added to your chart. To add the 20 EMA, you can select the ‘Indicators’ option on your chart, search for ‘Exponential Moving Average’ and add it. As shown below, you then adjust the settings to ’20’ to reflect the 20-day period.
For MetaTrader 4/5 Users
In MT4 or MT5, you can add the EMA to your chart by accessing the ‘Indicators’ list. You’ll find the EMA under the ‘Trend’ category of indicators.
After adding the EMA to your chart, set the period to ’20’ to adjust it to the 20-day EMA. You can also customize the color and style of the line to suit your preferences.
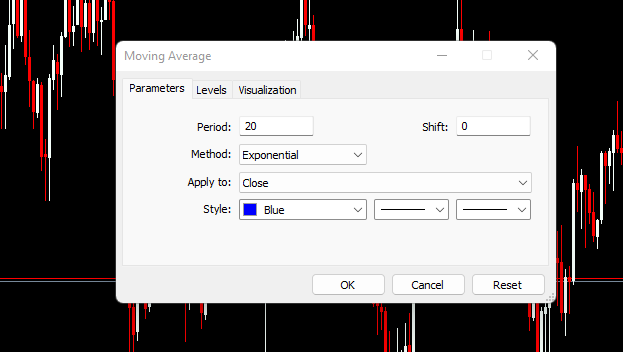
Similar to TradingView, in MT4/5, the 20 EMA can be used to gauge the market trend and to generate potential buy or sell signals based on the price’s position in relation to the EMA line.
4 Best 20 EMAs Crossover Strategies
A common application of the 20 EMA is in crossover strategies. Like the simple moving average crossover strategy, EMA crossovers help traders generate signals since they deploy two or more moving averages, usually slow and fast. For example, you might look for instances where the 20 EMA crosses above a longer-term EMA (such as the 50 or 200 EMA) as a bullish signal or below as a bearish signal. We will cover more about this in the next section.
The Exponential Moving Average (EMA) crossover strategy is a dynamic and versatile technique used in trading. It involves using two or more EMAs of different lengths to identify potential buying and selling opportunities. Here, we’ll explore four specific EMA crossover strategies that are popular among traders:
9/20 EMA Trading Strategy
This strategy involves using a 9-period EMA and a 20-period EMA. The 9-period EMA, being more responsive, is used for short-term trend indication. In contrast, the 20-period EMA offers a broader view of the market trend. As such, this combination is often used by traders who utilize the intraday trading strategy.
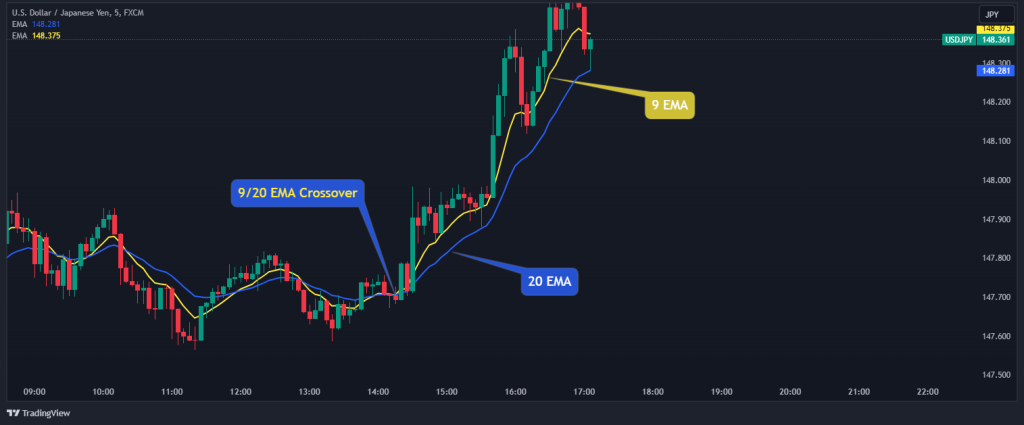
As seen in the chart above, trading the crossover provides easy entries for us. For instance, when there is a crossover of the 9 EMA above the 20 EMA, it indicates a potential uptrend, providing a buy signal. Conversely, a crossover below the 20 EMA suggests a potential downtrend, signaling a selling opportunity.
Best for scalping and intraday trading
5/20 EMA Trading Strategy
This strategy is similar to the 9/20 EMA strategy but uses a 5-period EMA. The 5-period EMA provides an even quicker response to price changes, making it ideal for more aggressive trading styles or markets with higher volatility. This strategy is often used by scalp traders who are looking for extremely minor price movements.
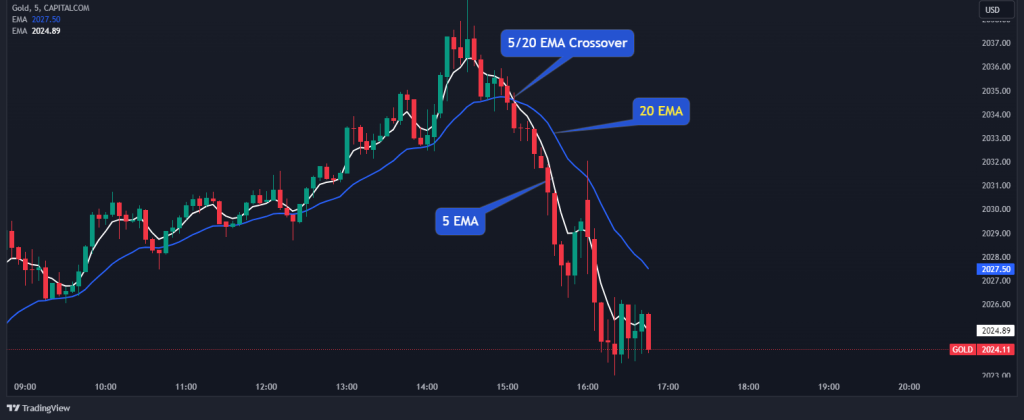
The crossover points of the 5 EMA with the 20 EMA are used to determine buy or sell signals. The shorter period EMA crossing above the longer one indicates a bullish trend, while crossing below signals a bearish trend.
Best for scalping and intraday trading
20/60 EMA Crossover Strategy
This strategy employs a 20-period EMA and a 60-period EMA. The longer 60-period EMA smooths out more fluctuations, providing a more stable trend indication. It’s particularly useful for medium to long-term trend analysis like the swing trading strategy. Technically, the crossover of the 20-period EMA above the 60-period EMA is interpreted as a bullish signal, and a crossover below is viewed as bearish.
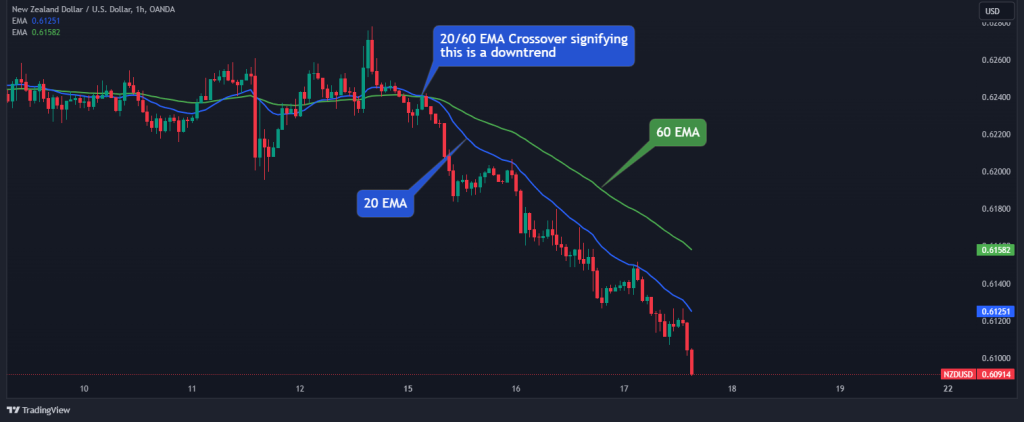
Best for swing and long-term trading
20/200 EMA Crossover Strategy
This strategy uses a 20-period EMA and a 200-period EMA. The 200-period EMA is a widely-watched indicator for long-term trend direction, usually being a part of the position trading strategy. A crossover of the 20-period EMA above the 200-period EMA may indicate the beginning of a long-term bullish trend. Conversely, a crossover below the 200-period EMA could suggest the start of a long-term bearish trend.
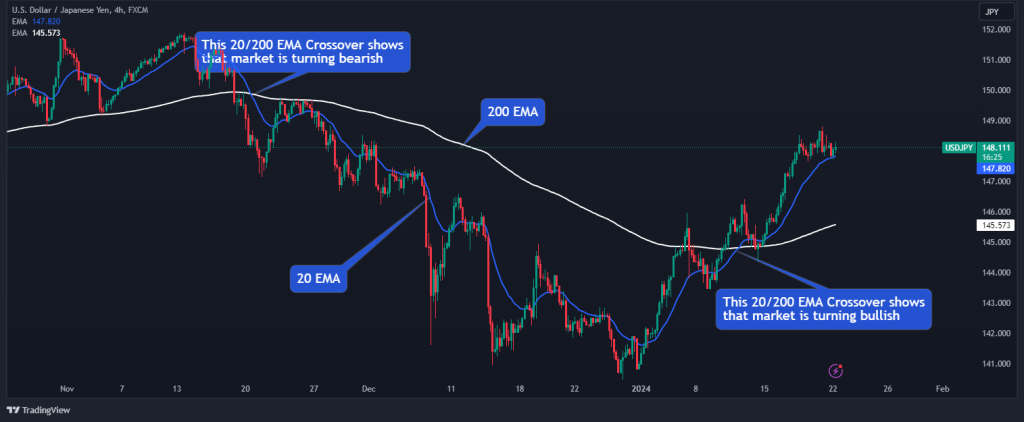
Best for: Position trading
How to Trade Using the 20 EMA Strategy?
We have mentioned a lot about using the 20 EMA to recognize trends and entry and exit points. Here, let’s take a closer look at how to trade one of the simplest and most effective but less discussed 20 EMA strategies: trading price reversals with the 20 EMA and the RSI Indicator as a confirmation tool.
1. Trade Setup
The first thing we want to pay attention to is setting our chart properly. The chart should include the two indicators as shown below. For the RSI, the default settings work best.
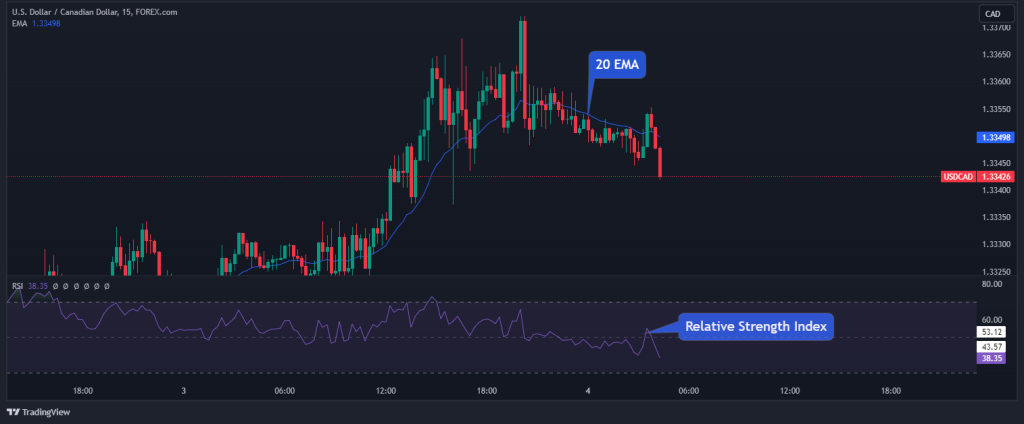
Once we have our setup in place, we can determine which timeframe is best for us, depending on our trading style. For the sake of this example, we will be using the 15-minute timeframe.
2. Trade Entry
The trading rules for getting an entry with this strategy are pretty straightforward and mechanical. The first thing you want to look out for when you hit the chart is to check if the RSI indicator is showing the market as oversold or overbought. For instance, the chart below shows us that the market is oversold. Hence, we can start looking for a buy confirmation using the 20 EMA.
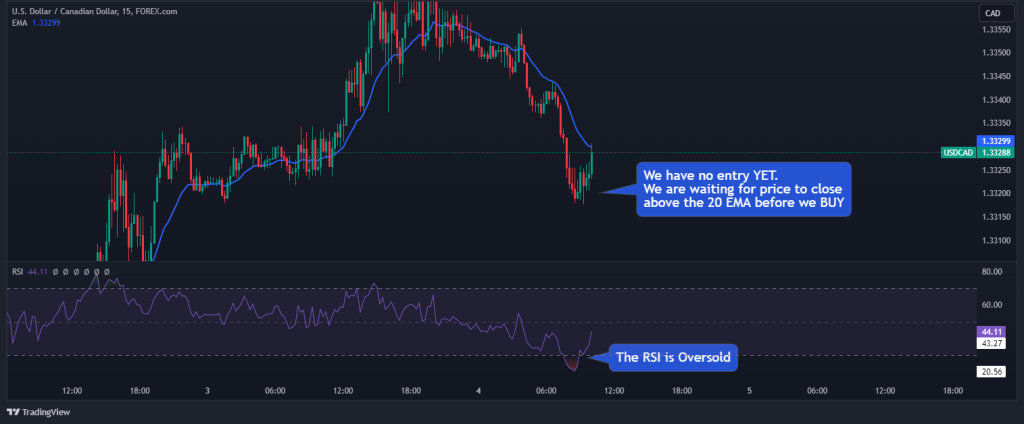
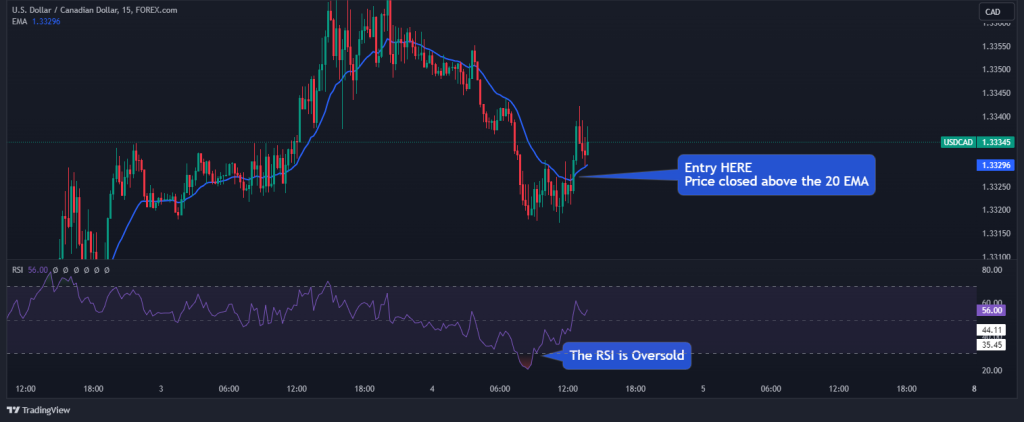
Now that we know we are expecting a buy trade, our confirmation entry is as simple as waiting for the price to close above the 20 EMA, as shown in the following price chart:
3. Stop Loss and Target Profit
Knowing that this strategy isn’t foolproof, it’s quite important for us to know where to place our stop-loss order. So, for this particular trade, we can easily place our stoploss some pips below the swing low.
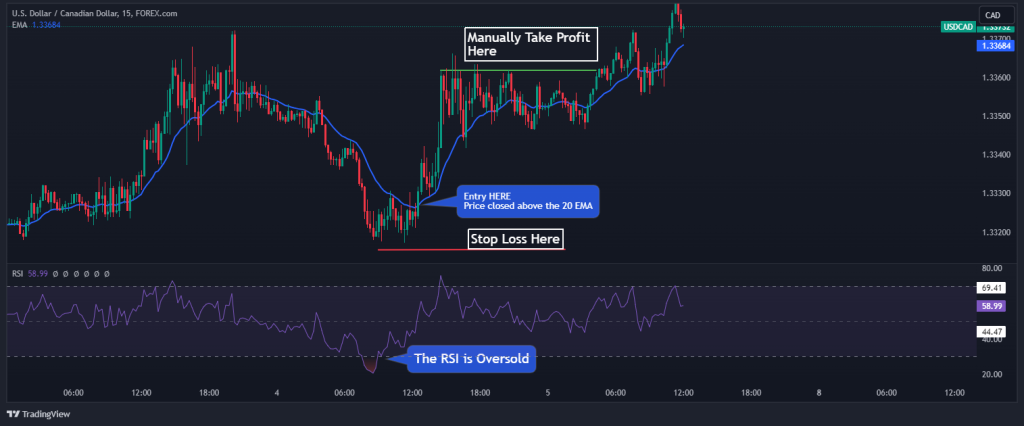
And for a sell trade, we can also place our stop-loss order above the swing high. Doing this gives our trade enough “room to breathe” and also being mistakenly taken out of our position by spread.
Setting the target profit order can be a little subjective. For instance, if you are a swing trader, you may want to hold the trade for a long period, seeing that it can be the beginning of a new trend. But for this illustration, we advise that you set a minimum of 1.5 risk-reward ratio for profit targets.
The Free 20 EMA Trading Strategy PDF
If you need something you can easily refer to, you can download our free 20 EMA trading strategy PDF here:
20 EMA Trading Strategy Free PDF Download
Learn to Trade the 20 EMA Strategy with HowToTrade
Starting to trade with the 20 EMA strategy involves a few key steps that we have mentioned earlier in this article; each one is pivotal to understanding and successfully implementing this approach in your trading. Yet, unlike other more advanced trading strategies, the 20 EMA is a simple forex trading strategy that can be easily implemented by all levels of traders. And, if properly used, the 20 Exponential Moving Average strategy can be a powerful tool for identifying market trends and hunting potential trade opportunities.
For further learning and refinement of your 20 EMA trading strategy, you should consider joining our trading academy. Here, you can access a wealth of resources, connect with other traders, and continuously improve your trading skills and knowledge. And when you’re really ready to trade the market, you can open a Switch Markets account and start trading.
Frequently Asked Questions About the 20 EMA Strategy
Here are some frequently asked questions on the 20 EMA strategy:
Is 20 EMA a good indicator to find trade signals?
The 20 EMA is indeed considered a good indicator for finding trade signals, especially due to its emphasis on recent price data. This makes the 20 EMA more responsive to new information than a simple moving average, which can be advantageous in a fast-moving market.
How is the 20 EMA used for intraday trading?
Absolutely. For intraday trading, the 20 EMA can be particularly useful. It helps identify good entry points in the market by waiting for a price pullback that tests the resistance level provided by the 20 EMA line. Traders often look for a valid confirmation of the price level to enter the market.
What EMA do most professional traders use?
Well, there isn’t a one-size-fits-all answer, as it largely depends on their trading style, the market they are trading in, and their specific trading strategies. However, commonly used EMAs include the 20-period EMA, as well as other periods like the 50-period and 200-period EMAs. The choice of EMA often aligns with the trader’s time frame for analysis and their approach to capturing market trends and reversals.
Risk Disclosure: The information provided in this article is not intended to give financial advice, recommend investments, guarantee profits, or shield you from losses. Our content is only for informational purposes and to help you understand the risks and complexity of these markets by providing objective analysis. Before trading, carefully consider your experience, financial goals, and risk tolerance. Trading involves significant potential for financial loss and isn't suitable for everyone.


