Candlestick Charts in Stock Trading
A candlestick chart is the most popular and widely used type of chart among stock traders, and for a good reason. This type of chart, developed in the 18th century by a Japanese rice trader, provides much more clarity and information than any other type of trading chart.
Regardless of the trading style, you are about to choose; you must learn how to read and analyze candlestick charts. This is a key component of technical analysis and chart patterns and the most commonly used chart type on trading platforms and financial news sites.
So, without further ado, let’s start!
What Are Candlestick Charts in Stocks?
Candlestick charts (also often referred to as Japanese candlestick charts) are one of the most popular types of charts used amongst stock traders that display the high, low, open, and closing prices for a predetermined time period.
Now, if you’re thinking this sounds familiar, then yes, they are a lot like bar charts. In fact, many traders refer to them as an upgraded variation of bar charts.
Just take a look at them side by side!
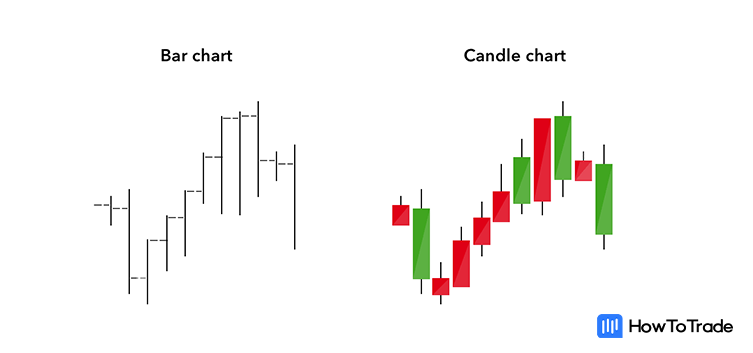
As you can see, while both chart types show the same price information, candlesticks are presented in a more appealing and informative format. Of course, it’s not just the fact that candlesticks look better. Stock traders also prefer this type of chart because it is more reliable and easier to interpret.
What Do Candlesticks Look Like?
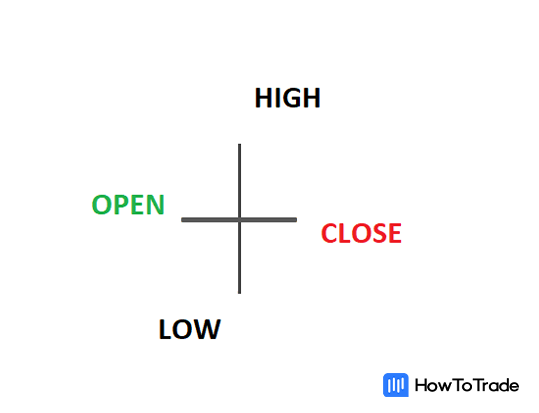
Japanese candlesticks are composed of three parts:
- Upper shadow
- Lower shadow
- Body
Below is a picture of what they actually look like.

Now, let’s talk a bit more about their bodies. The candlestick body, also called a real body, represents the price range between the open and close price of that trading day.
When their bodies are black (or, for those who prefer trading in color, red), it means the closing price was lower than the opening price. If the real body is empty (or green), it means the close was higher than the open.

As you can see in the image above, the left green candle has a higher closing price than the opening price, and it is, therefore, a bullish candle. On the other hand, the left red candle has a lower closing price than the opening, known as a bearish candle.
The Candlestick Figure
Now, not only can their bodies be different colors, but candlesticks also come in many different body sizes. For example, long bodies indicate strong buying or selling activities. The longer the body, the more intense the buying or selling pressure. This means that either buyers or sellers were stronger and took control and the current trend is likely to continue.
On the other hand, short bodies imply very little buying or selling activity and indicate indecision in price action. The shorter the bodies, the lower the demand for the chosen stock. A candlestick with a short body is known as Doji, which usually indicates that the stock price is likely to reverse.
The Shady Shadows
The candlestick shadows (also known as tails or wicks) or, in other words, the thin lines on the top and bottom of a candlestick if you like. These shadows are crucial to stock traders who use chart patterns to predict future price movements as they provide important clues about the next price move.
Upper shadows represent that the session was high. Conversely, lower shadows represent that the session was low.
Candlesticks with long shadows show that trading action occurred well past the open and close. Conversely, candlesticks with short shadows indicate that most of the trading action was confined near the open and close.
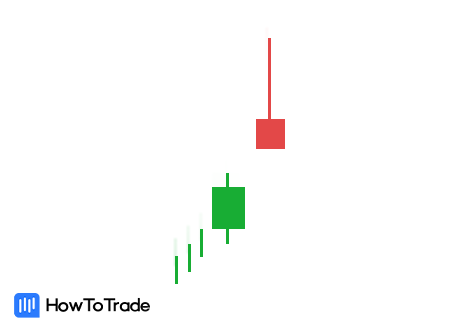
Let’s see an example of long shadows:
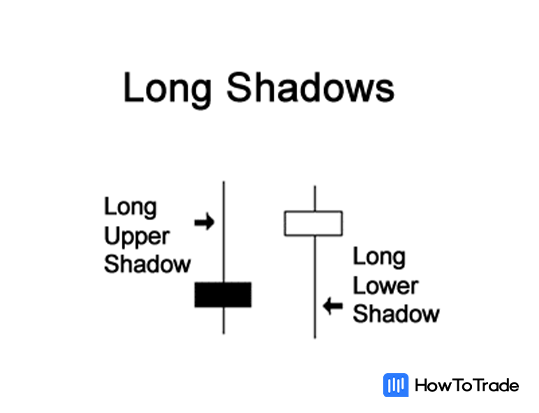
So, if a Japanese candlestick has a long upper shadow and short lower shadow, this means that buyers flexed their muscles and bid prices higher. However, sellers came in and drove prices back down to end the session near the open price. This shows that sellers are battling to gain control and may indicate that the next candle will be bearish.
On the other hand, if a Japanese candlestick has a long lower shadow and short upper shadow, this means that sellers flashed their washboard abs and forced the price lower. However, buyers came in and drove prices back up to end the session near its open price, indicating that the stock price is likely to rise in the next candlestick.
How Can You Read Japanese Candlestick Charts?
As we previously mentioned, knowing how to read candlestick charts is essential to analyzing the past performance of an asset. After all, every popular trading platform and news site gives you the option to use candlestick charts.
The first thing you need to know is the different time frames of candlesticks. A time frame is the duration of time of a single candle. Similar to the bar chart, there are different frame times stock traders and investors can choose from when using candlesticks. The most popular ones are as follows:
- 1-minute (M1)
- 5-minute (M5)
- 15-minute (M15)
- 30-minute (M30)
- 1-hour (H1)
- 4-hour (H4)
- Daily (D1)
- Weekly (W1)
- Monthly (M1)
The smaller the chart time frame you choose, the closer you look into price action. And it works the other way too. The bigger the view, the less detailed overview you will get. Usually, scalp and day traders use shorter time frames while swing and position trading look at daily, weekly and monthly charts.
In the chart below, you can see the Zillow stock price on a 5 min chart.
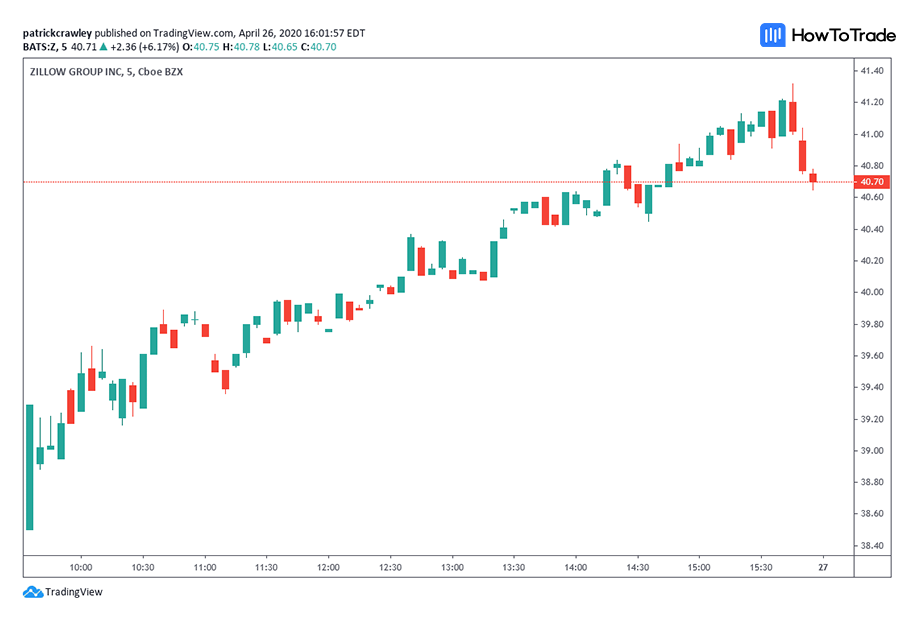
As you can see, the chart above provides information about each 5 min candle of the Zillow stock so you can analyze the stock’s past performance over the last 3-4 hours. However, If you decide to analyze the stock on a daily chart, you’ll get all the information about each trading day and its price movement over a certain period.
Now, that’s all you need to know for now when it comes to the way Japanese candlesticks look. Next, let’s take a look at some common candlestick patterns and what these mean on stock charts.
Stock Chart Patterns
At basic, candlestick chart patterns are a way of viewing price movements that occur during a predetermined trading period. As the nature of markets is repetitive, traders and long-term investors typically use these chart patterns to predict the next move of stocks.
Chart patterns can be either continuation candlestick patterns that indicate the existing trend is likely to continue or trend reversal patterns that signal that a new trend might begin.
These come in four categories:
- Basic Candlestick Patterns
- Single Candlestick Patterns
- Dual Candlestick Patterns
- Triple Candlestick Patterns
Let’s explore the formations below and find out what they mean in terms of price action.
Basic Candlestick Patterns
Top. Marubozus. Dojis.
No, we are not speaking a different language. All of the above are some basic candlestick patterns used by traders to find entry and exit levels. But, there are many more of them.
Let’s look at them in a bit more detail.
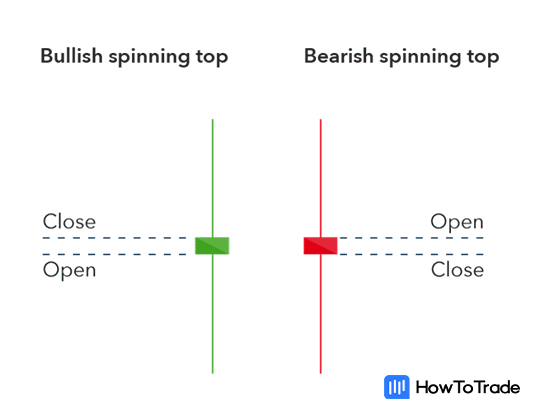
What are Spinning Tops?
A spinning top is a candlestick pattern with a short body that’s vertically centered between long upper and lower shadows. Generally, this candlestick pattern indicates uncertainty in the market and indecision between the buyers and sellers and, in most cases, may suggest that the price is likely to reverse.
What is Marubozu?
Marubozu is a long candlestick with no upper or lower shadow and is very easy to spot due to its long body. The longer the candle, the stronger the price movement! This means that if you have identified a bullish Marubozu candle, there’s a strong buying pressure and you get a signal to enter a long buying position.

What are Dojis?
Doji candlesticks are unique candlestick formations where the opening and closing prices are equal (or almost exactly equal), and their bodies appear as a very thin line. Like the spinning tops, a Doji candlestick also represents uncertainty and indecision in the market and indicates a strong likelihood of a reversal.
Single Candlestick Patterns
Single Candlestick Patterns. Their name comes from the fact that they are composed of just one candlestick. There are many types of single candlestick patterns, each of which has a bullish and bearish pattern version. For example: Hammer (bullish) and Hanging Man (bearish), Inverted Hammer (bullish) and Shooting Star (bearish).
Let’s explore in depth these patterns and how to use them.
What is Hammer and Hanging Man?
Hammer and Hanging Man are single candlestick patterns with a small body at the top and a wick at the bottom that is two or three times longer than the body.
If this single candlestick pattern appears in a chart with an upward trend indicating a bearish reversal, it is called the hanging man.

If it appears in a downward trend indicating a bullish reversal, it is called a hammer. It got its name because the market is hammering out a bottom.
What are Inverted Hammer and Shooting Star Candlestick Patterns?
Both the inverted hammer and shooting star candlestick patterns appear as a candle with a small body at the bottom and a wick at the top that is two or three times longer than the body.
An inverted hammer is a bullish reversal candlestick. It appears when prices are falling and indicates that the downtrend may have reached its bottom limit and that prices may be about to reverse upwards.

A shooting star is a bearish reversal candlestick. It appears when prices rise and indicates that the uptrend may have reached its top limit and that prices may be about to reverse downwards.
Dual Candlestick Patterns
What’s better than patterns with single candlestick patterns? Patterns with TWO candlesticks! Dual candlestick patterns are chart formations that consist of two candles. Like the single candle patterns, dual candle patterns have bullish and bearish versions. Some of these include:
- Engulfing candles (bullish engulfing and bearish engulfing)
- Tweezer bottoms and tops
- Bullish harami, bearish harami, bullish and bearish harami cross
Let’s see examples of the engulfing and tweezer patterns:
What is a Bullish Engulfing Candle?
A bullish engulfing pattern is a dual candlestick pattern, which might signal an upcoming uptrend. The pattern applies after a period of consolidation or downtrend.

What is a Bearish Engulfing Candle?
A bearish engulfing candle is a dual candlestick pattern, which signals an upcoming downtrend. The pattern applies after a period of consolidation or an uptrend.

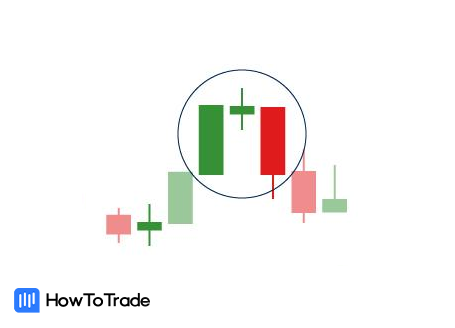
What is a Tweezer Bottom Candle Pattern?
A tweezer bottom candlestick pattern is a bullish reversal pattern that can be spotted at the bottom of a downtrend. It consists of two candles with very similar new lows, while the second candle reflects more bullish market sentiment as the prices burst higher, in the opposite trend.

What is a Tweezer Top Candle Pattern?
A tweezer top candlestick pattern is a bearish reversal pattern that can be spotted at the top of an uptrend. The first candle is bullish but shows rejection of higher prices, and the second candle attempts to surge higher but fails. It signals that the resistance is strong, and the market will decline and consolidate.

Triple Candlestick Patterns
Finally, triple candlestick patterns. And as the name suggests, these candle patterns are made of different formations of three consecutive candlesticks. Let’s see some of the most commonly used triple candlestick stock patterns.
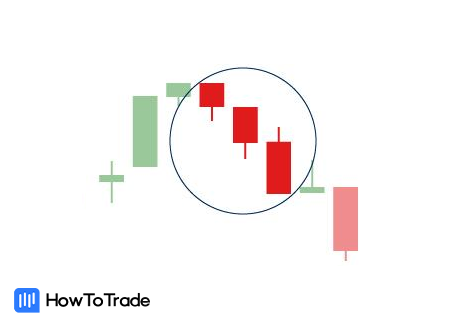
What is an Evening Star Candlestick Pattern?
The evening star pattern is a three-candle, bearish reversal candlestick pattern that appears at the top of an uptrend. The third candlestick confirms the reversal and signals the slowing down of upward momentum before a bearish move lays the foundation for a new downtrend.
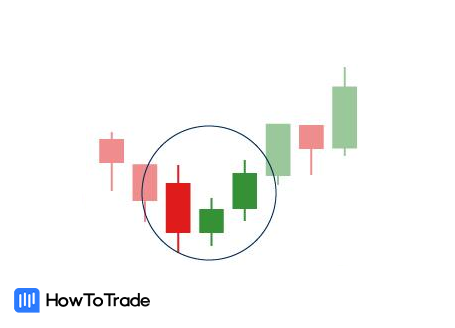
What is a Morning Star Candlestick Pattern?
The morning star candlestick is a three-candle, bullish pattern that signals a reversal in the market. The morning star can be found at the end of a downtrend, signifying a potential turning point in a rising market.

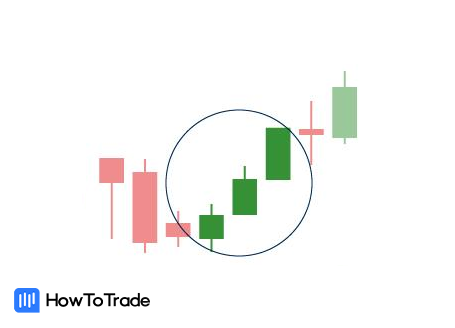
What is a Three White Soldiers Candlestick Pattern?
Three white soldiers is a bullish candlestick pattern used to predict the reversal of the current downtrend in a pricing chart. The pattern consists of three consecutive long-bodied candlesticks that open within the previous candle’s body and a close that exceeds the previous candle’s high.
What is a Black Crows Candlestick Pattern?
The three black crows pattern is a bearish reversal pattern used to predict the reversal of the current uptrend in a pricing chart. It usually indicates weakness in an established uptrend and signifies the potential emergence of a downtrend.
What is a Three Inside Up Candlestick Pattern?
The three inside up is a bullish reversal pattern that occurs at the end of a bearish trend, signaling the beginning of a potential reversal.
What is a Three Inside Down Candlestick Pattern?
A three inside down is a bearish candlestick reversal pattern that forms at the end of an uptrend, signaling a shift in the direction of the trend. The pattern consists of a positive candle followed by an inside bar, after which the price breaks below the opening of the first candle.

Summary
That’s it, phew! After you have completed this lesson, you will be able to read and interpret candlestick stock charts. Furthermore, you know how to use chart patterns to predict stock future price movements.
Remember, if you learn how to analyze stock price action using Japanese candlestick charting techniques, you can acquire a valuable skill. It is one of the most essential and practical tools you need as a trader.
Now, if you feel ready, we think it’s time to open a demo account and see these candlestick stock patterns on a real live trading platform. Let’s do it.


Up To $5,000 Credit!
- Trade 1,000’s of global markets.
- 0% deposit and withdrawal fees.
- Rapid funding turn-around times.
- Trade on MetaTrader 4 and 5.