Stock Market Charts [3 Different Types]
The ultimate goal of HowToTrade Academy is to provide traders and investors with an arsenal of weapons they can use to battle against other traders in the stock market. And this level is no different.
In fact, by the end of this level, you will have added yet another weapon to your collection. And I dare to say; it is one of the most important ones when it comes to technical analysis and predicting future price movements of stocks.
This level is all about stock charts – what they are, how to use them for trading, spot chart patterns, trend lines, and other valuable techniques that could potentially make you money. So, let’s start!
What Are Stock Market Charts?
Stock price charts are the gateway to price analysis and the technical analysis methodology. Charts, or more specifically, price charts, are a graphical representation of a stock price movement over a period of time, whether it is the last hour, day, week, or year. Each type of chart (including point and figure charts) provides information about the opening price, closing price, and highest and lowest prices at a specific time frame.
Basically, stock trading charts are essential to long-term investors and active traders, as they reveal historical data and how certain stocks have performed over a set period of time (whether it is 1 hour, 4 hours, a day, a week, or a month).
This is extremely important for traders as they use technical indicators and repetitive chart patterns to predict the next price movement of a stock or any other financial asset.
There would be no technical analysis as we know it today without charts. It doesn’t matter what type of trader you are or your preferred trading method; everyone serious about becoming a trader has to learn how to read stock charts – there really is no escaping it.
So what does a stock chart look like? Let’s take a look at two of the most popular chart types – a candlestick chart and a bar chart.
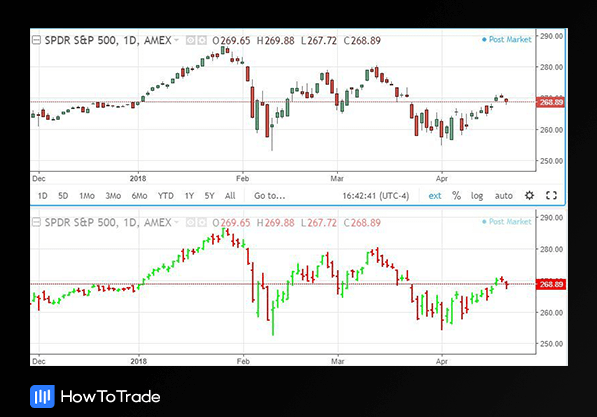
Now, it may seem like there’s so much going on, and it will be a real pickle trying to understand them, but it’s not that difficult to learn how to read stock charts. You’ll get used to trading with price charts in no time. It’s like riding a bike. It gets easier in time.
What you see at the top price chart is what we call a candlestick chart. It got its name because it is made out of candlesticks and presents a lot of information, including the high, low, opening, and closing prices.
We will learn more about trading with Japanese candlesticks in the following lessons. All you need to know for now is that they are the most widely used type of chart amongst stock traders.
The other two popular types of charts used for trading that we will further explore in the following chapters are bar charts and line charts. They’re all completely different when it comes to their looks, but at the same time, they are the same at their core. They help traders understand the central point and what is going on in price by providing them with a clear overview of a stock price performance quickly.
So Why Do We Need Stock Charts for Trading?
To put it simply, they are the key to making it in the stock market. Without price charts, one wouldn’t understand the price action and what is happening in the stock market and certainly wouldn’t be able to get any trade ideas, or spot a price trend or price patterns.
And that’s particularly true if you plan to trade actively and apply scalping, day trading, or swing trading strategies. Using stock charts will help you identify a downward or upward trend, a trend reversal, trading volume, a particular price pattern, and know the high and low prices of the stock in a specific time frame. In a nutshell, you must know how to use all types of stock charts.
And that’s the whole point. To find trade ideas and spot big movements before they happen so that we can ride them out and take in the cash. For example, many traders use high and low prices to enter a trade once the price rises above the highest price or breaks below the lowest price.
Others might draw support and resistance levels and use Japanese candlestick charting techniques to identify market trends. All the above-mentioned details and techniques are not possible without the use of chart analysis. Simple as that.
What Happens Next?
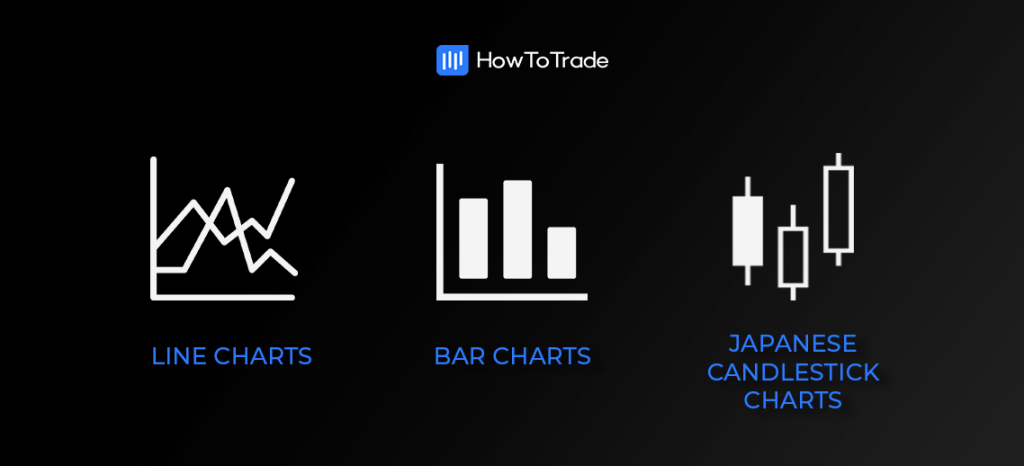
In the following lessons, we will teach you more about how to read and trade using stock charts and technical analysis. We will take a look at the three most popular stock price charts used for technical analysis to monitor the stock market, different stocks, and securities and how you can use them to your advantage when trading.
These three most popular charts used by technical analysts to trade are line charts, bar charts, and candlestick charts. Once you start trading, charts (and other technical tools) will be a big part of your day-to-day life. You must know how to read and interpret each type of chart, which we will show in the next lessons. Let’s start with a line chart!


0% Commission Accounts
- Trade 1,000’s of global markets.
- 0% deposit and withdrawal fees.
- Rapid funding turn-around times.
- Trade on MetaTrader 4 and 5.