


Single candlestick patterns are highly effective and easy-to-recognize chart patterns in trading.
These patterns help traders understand the market psychology and can present good entry and exit points. One of the popular single candlestick patterns is the pin bar pattern, a single bar that provides a strong indication for the next price movement.
- The Pin Bar Candlestick pattern is a powerful tool for day trading due to its clear visual cues.
- Understanding the Pin Bar pattern can offer traders a window into prevailing market sentiment.
- It’s crucial to weigh the strengths and potential pitfalls of the Pin Bar pattern before implementing it in trades.
In this guide, we’ll discuss the pin bar chart pattern and how to trade it.
- What is the pin bar candlestick pattern?
- What types of pin bars are there?
- How to identify a valid pin bar candle in trading?
- How do you trade the pin bar candlestick pattern?
- The Pin Bar Trading Strategy PDF
- What are the Benefits and Limitations of the pin bar pattern
- What’s the difference between the pin bar and the doji
- What is the difference between a pin bar and a hammer candlestick?
- Key takeaways
- Frequently asked questions (FAQs)
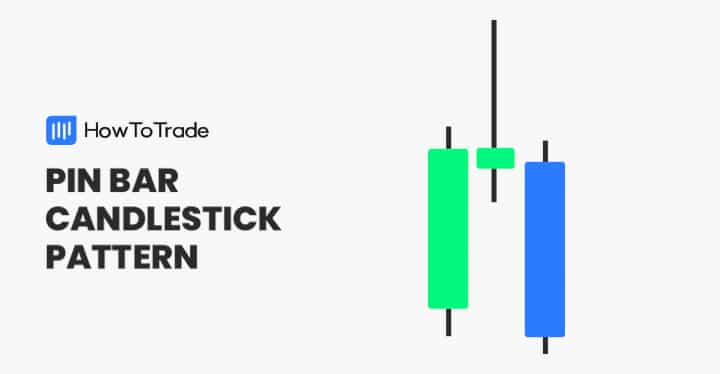
What is the Pin Bar Candlestick Pattern?
The pin bar is a single candlestick pattern with a long wick and a small body that helps traders find entry and exit levels. Interestingly, the pin bar is short for Pinocchio Bar. Martin J. Pring, an expert technical analyst, was the first to name the pattern as a pin bar.
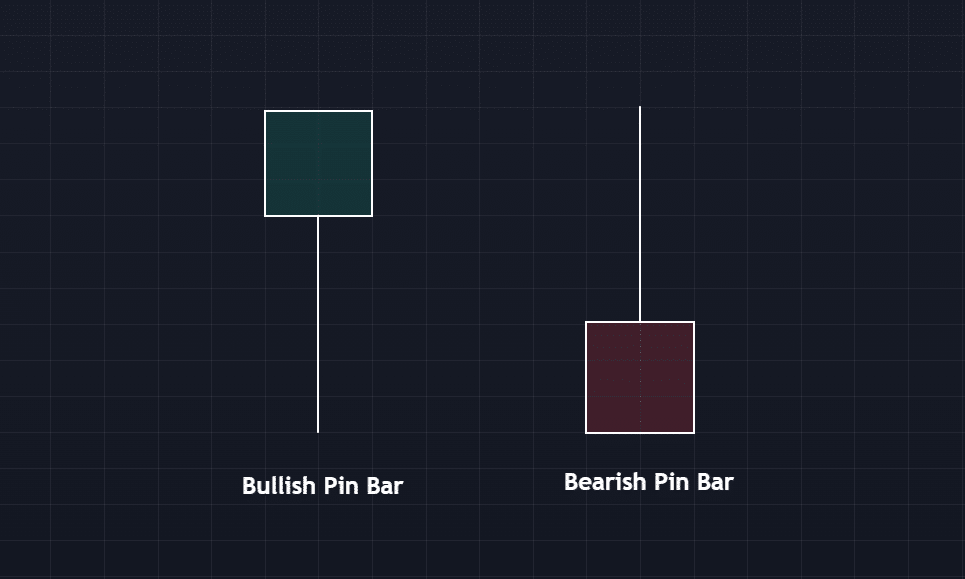
The pin bar appears to have a long wick and a small body. Ideally, the body should be less than a third of the entire range of the candlestick, with the wick making up the two-thirds. So, for a bullish pin bar, the long wick is below the body. And for a bearish pin bar, the long wick is above the body.
Technically, the small body of the pin bar reflects that the existing trend is weakening, while the long wick, also known as the pin bar tail, suggests that the market has overreacted and the trend will likely change direction. So when you think of pin bar as Pinocchio, you’ll easily understand its whole concept. The small body and long wick mean that the market has ‘lied’ to us, resulting in a long wick, just like Pinocchio’s nose.
Some may confuse the pin bar pattern with the spinning top candlestick pattern. However, both patterns are different. Even though the spinning top candle pattern has a small body, it has upper and lower wicks.
Also, the spinning top generally signals indecision between buyers and sellers, while the pin bar actually indicates that the market is likely to move in a specific direction.
What Types of Pin Bars Are There?
As far as the direction of the price action after the appearance of the pin bar is concerned, there are two types: Reversal and Continuation.
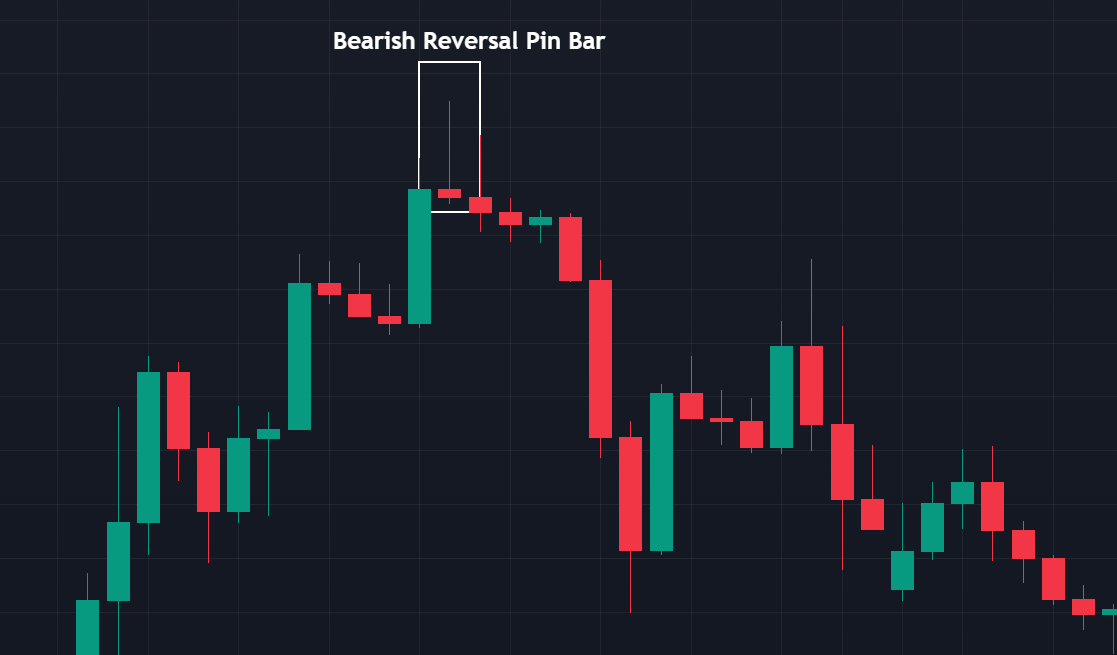
Reversal Pin Bar
The reversal pin bar suggests that the price will likely reverse and change trends. And you’ll usually find this type of pin bar at the bottom of trends or close to important key levels, such as support and resistance. When the pin bar appears, you’ll notice that the long bar is in the direction opposite to the reversal. For instance, a bearish reversal pin bar would have its long wick facing upward. When all the confluences match, the trend is likely changing bearish.
On the other hand, a bullish reversal pin bar has its long wick facing downwards. And it usually precedes a bullish reversal.
Continuation Pin Bar
The continuation pin bar tells you that the current trend will likely continue. In fact, you’ll often find this pattern during strong trends close to strong dynamic support and resistance levels like the 9 EMA.
This pin bar, just like its reversal counterpart, has its wick in the opposite direction to the continuation.
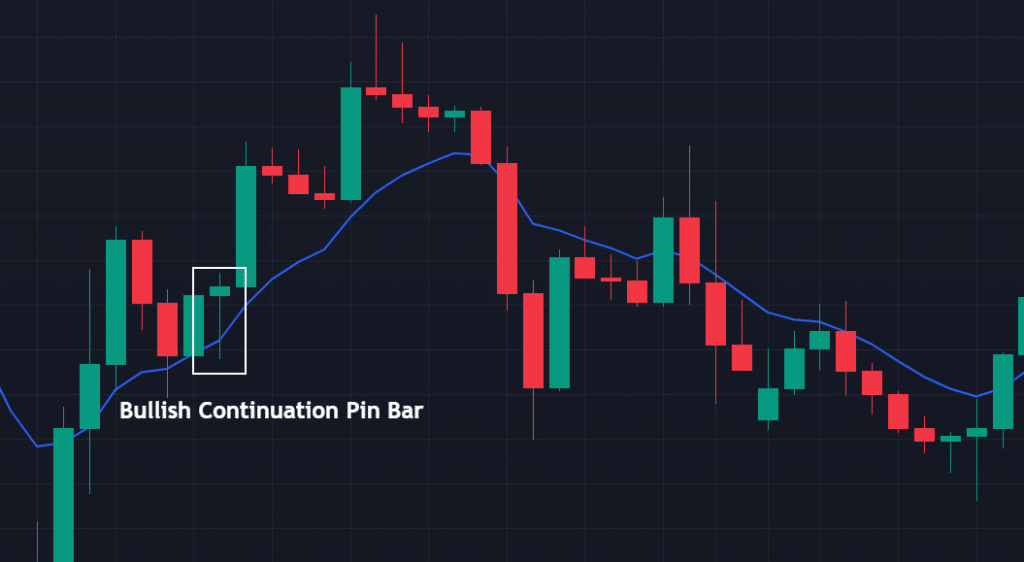
For instance, a bullish continuation pin bar has its wick beneath, while the bearish continuation pin bar has its wick above.
How to Identify a Valid Pin Bar Candle in Trading?
Overall, it’s relatively easy to identify pin bar candles, as it is a chart pattern that frequently appears in the markets and consists of only one candlestick. As mentioned earlier, the pin bar has a small body with a long upper or lower wick. However, not all pin bars are valid. Here are four factors to identify valid pin bars on your chart:
1. The Timeframe
Pin bars tend to be more reliable when they appear on higher timeframes. A pin bar on the 4-hour, daily, or higher timeframe tends to hold more value than those that form on the 1-hour or lower chart, from my experience. As a result, we recommend that you stick to the higher timeframes when trading pin bars.
If you must trade the pin bar on the smaller timeframe, wait for the pin bar to confirm the direction on the larger timeframe. Only then can you drop to the lower timeframe to look for trade entries in the direction of your pin bar forecast.
2. Key Levels
Pin bars that form around key levels are more reliable. These key levels can be support and resistance zones, Fibonacci retracement zones, moving averages, or just about anything that suggests that a price area is pivotal.
As such, when a bullish reversal pin bar forms at a support zone from past price action, it increases the chances that the trend is about to change from bearish to bullish. Similarly, suppose a bearish continuation pin bar appears just below (or even with the wick across) a moving average. In that case, you have more reason to believe that the trend is likely to continue downward.
3. Market Condition
Market conditions are another important factor to consider when picking out valid pin bar patterns. If the trend is heavily bearish with no key supports in view, for instance, any bullish reversal pin bar that appears will likely be false.
Ideally, you want to see:
- A bearish continuation pin bar in a bearish trend and below a strong resistance level.n
- A bullish reversal pin bar in a bearish trend that has approached a strong area of support.
- A bearish reversal pin bar in a bullish trend approaching a strong area of resistance.
- A bullish continuation pin bar in a bullish trend and above a strong support level.
4. The Surrounding Candlesticks
In its bearish version, the pattern becomes valid when the pin bar candlestick appears between the bullish and the bearish candles, meaning the first candle is bullish, the middle candle is the pin bar candle, and the last candle is bearish, almost like the evening star pattern.
The opposite occurs on the bullish pin bar pattern when the pin bar candlestick appears between the first bearish candle and the third bullish candle, similar to the morning star candlestick pattern.
How Do You Trade the Pin Bar Candlestick Chart Pattern?
Like many other single candle patterns, trading pin bars can be confusing, as sometimes false signals may occur. In addition, the pattern can often act as a continuation rather than a reversal. So, how can you ensure it provides a reversal or a continuation signal?
There are several trading strategies that can help you with that. The most effective method to confirm price reversals is by using technical indicators like the RSI, Stochastics, or Fibonacci levels. Generally, trading chart patterns are most effective when combined with Fibonacci retracements, as they can act as support and resistance levels and help you spot perfect reversals.
So, to get a better idea of how to confirm a reversal and trading pin bar patterns, below, we will show you the bullish and bearish pin bar patterns with Fibonacci retracement levels as an extra confirmation tool.
1. Bullish Pin Bar Candle Pattern and Fibonacci Levels
The bullish pin bar candlestick pattern appears in a downtrend and marks the end of the bearish trend, meaning it signals a bullish trend reversal. In essence, bullish pin bars indicate sellers have dominated the market, but now their strength is waning. So, when a bullish pin bar appears, it’s an excellent sign to enter long positions or exit short ones.

In the GBP/USD chart above, you can see how the bullish pin bar candle pattern indicates that the bearish trend is over. Additionally, we added Fib levels from the bottom to the top of the previous price trend.
Now, a bullish signal is made as the pin bar pattern forms near the 50% Fib level. In such a scenario, after the appearance of the pin bar and the bullish third candle, you know it is a trend reversal rather than a continuation.
As for the entry, you can enter the trade after the formation of the pin bar candle, or you can play safe and wait for the next candle to close and then enter the trade. Moreover, you can set the take-profit at the next Fib level, or you can try to extend the profits along with the following Fib levels.
Exiting your position through a stop loss is easy. You simply place your stop loss just below the pin bar or at the 61.8% Fibonacci retracement level.
And for your take-profit levels, you can afford to be more dynamic. You can stick to a strict 1:2 or 1:3 risk-to-reward ratio. You can also target a resistance level in the direction of your trade. Some professional traders even hold the trade until they see any other valid reason to exit.
We recommend, however, that you stick to a risk-to-reward trade exit system. It is safe for beginners and reduces the burden of overanalysis when getting out of the trade.
2. Bearish Pin Bar Candle Pattern and Fibonacci Levels
The bearish pin bar pattern occurs at the end of an uptrend or during a correction in the market. The pattern suggests a bearish reversal and provides a short-sell trading signal. When bearish pin bars appear, the bullish momentum is weakening, and you can find the opportunity to enter a short sell position or exit a long position.

In the chart above, we switched to a daily time frame and placed Fib levels from the top to the bottom of the previous price swing. As you can see, this time, the pin bar candle formation appears during a downward trend when the market is in correction mode. After the price tested the 50% Fibonacci level, it spiked back up, and a perfect pin bar candle was formed.
In this case, you’ll enter a trade when the pin bar forms or somewhere around the 61.8% Fib level. Stop loss could be placed slightly above the highest level of the pin bar, and take profit could be placed at any of the following Fibonacci levels.
Moreover, as seen in the example above, the price dropped to the 50% Fib level and then climbed up again to the 61.8% Fib level. This has created a double top pattern, and the final drop below the 50% Fib level provides a perfect signal to enter a short-selling trade.
The Pin Bar Trading Strategy PDF
If you need a PDF that describes how to trade the Pin Bar trading strategy, here’s one for you:
The Pin Bar Trading Strategy PDF
What are the Benefits and Limitations of the Pin Bar Candlestick Chart Pattern?
Let’s see some pros and cons of trading with the pin bar candlestick pattern.
Pros
- As a single candlestick pattern, it’s relatively easy to identify the pin bar pattern
- The pattern is a very reliable indicator of a trend reversal
- Excellent risk-reward ratio
Cons
- The pattern can signal both a continuation of the trend or a reversal, making it confusing and difficult to take positions
- Pin bars are less effective on lower time frames
What’s the Difference Between the Pin Bar and the Doji
Both the pin bar and the doji are key candlestick patterns used in technical analysis. However, that is where the similarities end. These two patterns are different in their structures, interpretation, the trading signal they forecast, and even the market conditions surrounding their appearance.
Structurally, the pin bar has a small body with a long wick (shadow) that protrudes significantly from one side. On the other side, the wick is either very small or non-existent. And depending on where it appears, it could signify a reversal or a continuation.
A doji, on the other hand, has a very small or non-existent body, with upper and lower wicks of varying lengths. And it suggests market indecision, where buyers and sellers are in equilibrium.
Market-context-wise, the pin bar is often found at trend reversal points, confirming strong buying or selling pressure. It’s not uncommon to find traders placing trades based on this candle alone, which isn’t something the Doji can boast of. The Doji frequently appears in ranging markets or during periods of uncertainty, making it less actionable without additional context.
That said, the Doji isn’t useless. There are ways to use the candlestick pattern. We discuss them here:
What is the Difference Between a Pin Bar and a Hammer Candlestick?
Like the pin bar pattern, the bullish hammer candle has a small body and long wicks. However, the hammer pattern only appears in a downtrend and signals a bullish reversal. In contrast, the pin bar pattern could appear at any market condition and signal a reversal or continuation of the trend.
Additionally, the pin bar is generally seen as a stronger and more versatile pattern in various market conditions, while the Hammer is effective mainly in downtrends and requires additional confirmation for higher reliability.
Key Takeaways
In a nutshell, here are the key takeaways of identifying and trading the pin bar candlestick pattern.
- The pin bar is a single candlestick reversal pattern with a short body and long wicks
- The pattern can be either bullish or bearish and may appear at the top of an uptrend, downtrend, or correction mode during an existing trend
- When trading forex using the pin bar pattern, confirmation is needed. Highly effective indicators to combine with the pin bar pattern include Fibonacci retracement levels or momentum technical indicators such as RSI, MACD, and stochastics
- To trade the pin bar candle pattern, you should wait for the third candle to close. Once the third candle closes in the other direction of the first candle, a signal is made, and you can enter the trade
Frequently Asked Questions (FAQs)
Check out the most frequently asked questions about the pin bar candlestick:
Is a pin bar candle pattern bullish or bearish?
The pin bar pattern can be either bullish or bearish. It all depends on the market context and direction of the market when the pattern is formed.
What is the pin bar trading strategy?
A pin bar is a chart pattern trading strategy that helps traders find a particular price level rejection and the beginning of a new trend. As it enables traders to set a tight stop loss and, thus, a good risk-reward ratio, many traders often use pin bar trading strategies to enter a position and find profitable trades.
Risk Disclosure: The information provided in this article is not intended to give financial advice, recommend investments, guarantee profits, or shield you from losses. Our content is only for informational purposes and to help you understand the risks and complexity of these markets by providing objective analysis. Before trading, carefully consider your experience, financial goals, and risk tolerance. Trading involves significant potential for financial loss and isn't suitable for everyone.
