- The OTE in Inner Circle Trading is the zone where retail traders can identify optimal entry points that are likely to offer the best returns for risks.
- The two keys in identifying an OTE are trend identification and Fibonacci Retracement levels.
- Combining OTE with other trading strategies is the best way to maximize its potential in spotting high probability entry points in the forex market.
Do you ever feel like you’re never able to catch market trends at the best spots? Your stop loss is either too much or too little, making your profit target a little too far beyond reach or too little. Inner Circle Traders (ICT) have a concept to help you do that: Optimal Trade Entries (OTE), which is the range between the 0.62 and 0.79 levels of the Fibonacci Retracement tool.
This technique leverages price action analysis and Fibonacci retracements to identify high-probability entry points within established trends. By understanding where “smart money” might enter the market, OTEs aim to help you get the best reward for your risk.
After going through this piece, you’ll understand:
- What Optimal Trade Entry is about.
- How to identify it on your chart, and,
- How to trade it.
 Table of Contents
What is the Optimal Trade Entry in ICT?
The Optimal Trade Entry, as the name implies, is the zone where you’re likely to get the best reward for your risk. It is the range between the 0.62 and 0.79 levels of the Fibonacci retracement tool. According to the ICT trading methodology, this zone is where your risk is neither too little nor too high and is likely to give you the best return.
The core principle lies in recognizing temporary price retracements within an established trend. Markets rarely move in a straight line, and these retracements offer potential entry points for capitalizing on the trend’s resumption.
By combining price action analysis, Fibonacci retracements, and an understanding of smart money behavior, OTEs equip you with a targeted approach to entering trades. The core idea is to align your entries with the potential moves of these big players, riding the trend wave they might be creating.
How Do You Identify Optimal Trade Entry (ICT) Zones in Your Chart?
Generally, due to the theory behind Optimal Trade Entry, OTEs are more effective in a trending market. When the price is trending, it forms higher highs and lows in a bullish trend and lower highs and lows in a bearish trend. This makes it easier for an ICT trader to identify OTEs in trending markets rather than sideways market conditions.
With this understanding, here’s how to identify optimal entry points in your chart in two steps.
1. Trend Confirmation: The first step is to confirm a clear uptrend or downtrend using market structure analysis. Higher highs and higher lows denote an uptrend, while lower lows and lower highs denote a downtrend.
2. Fibonacci Retracement Levels: Once you have a confirmed trend, Fibonacci retracement levels are overlaid on the price chart spanning across the swing points. For that matter, you need to learn how to use the Fibonacci retracement tool. The OTE zone typically ranges from 0.62 to 0.78. This zone represents a potential retracement area where prices might stall or reverse before continuing the trend.
Check out our daily market analysis page for insights about leading FX pairs, global indices, and commodities.
Optimal Trade Entry: Trade Setup and Rules
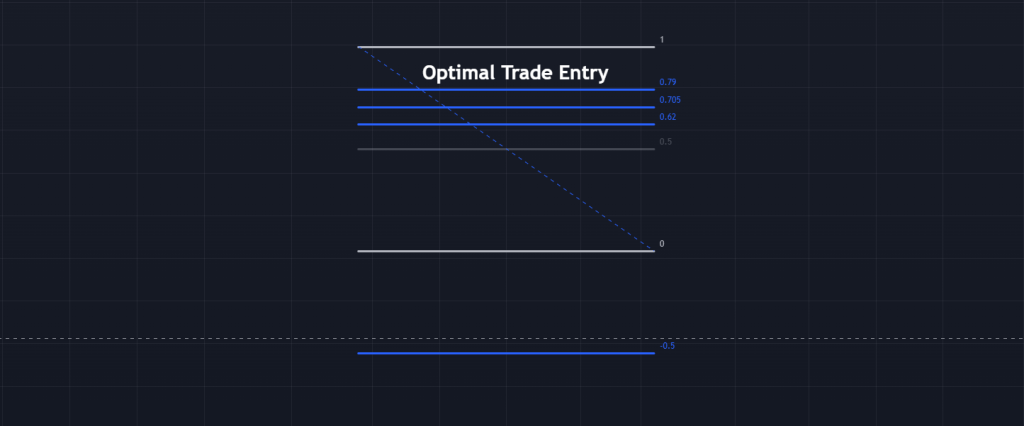
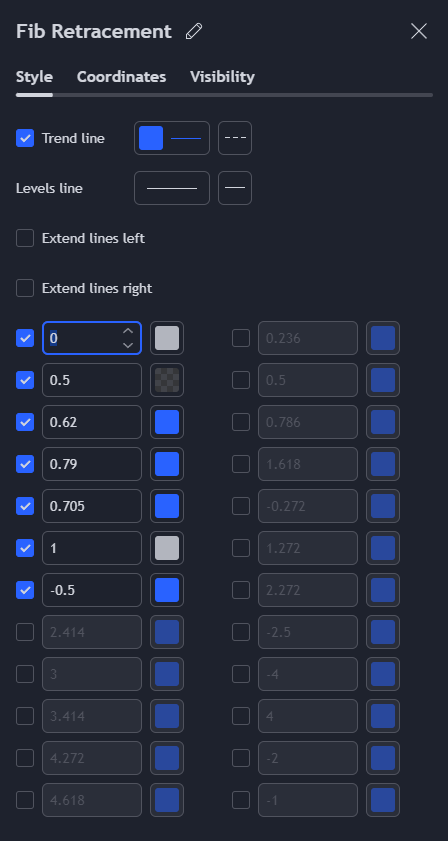
The Optimal Trade Entry zone uses different levels of the Fibonacci retracement from the tool’s default settings. For the ideal OTE setup, edit your default Fib levels according to the following settings.
| Fibonacci Retracement Level | Description |
| 0 | First Profit Scale |
| 0.5 | Equilibrium |
| 0.62 | OTE Boundary 1 |
| 0.705 | OTE |
| 0.79 | OTE Boundary 2 |
| 1 | Starting Position |
| -0.5 | Target 1 |
Take note that the actual OTE level is 0.705, but anything between 0.62 and 0.79 still falls within the OTE boundary.
If you’re on the TradingView charting software, this is what the OTE Fibonacci levels are likely to look like for you:
How To Trade the Optimal Trade Entry Strategy?
The OTE is one of the most straightforward ICT tools with which you can make trade entries, and there are two ways to go about this:
1. Entering Trades Directly on the OTE
The first and most direct way to use the OTE is to set limit orders at the OTE zone. It gets even better when this OTE zone coincides with another important Inner Circle Trader concept, e.g., Fair Value Gaps or Breaker Blocks.
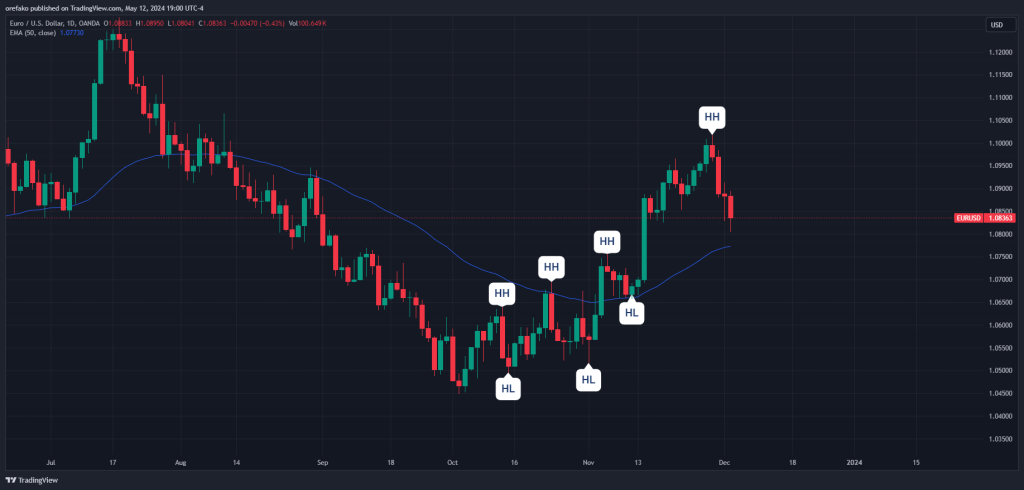
In the EURUSD chart below, for instance, we have a bullish market because there is a series of higher highs (HH) and higher lows (HH). To confirm this, we use the 50-period Exponential Moving Average indicator, which clearly shows that the price is in an uptrend because the line is below the price.
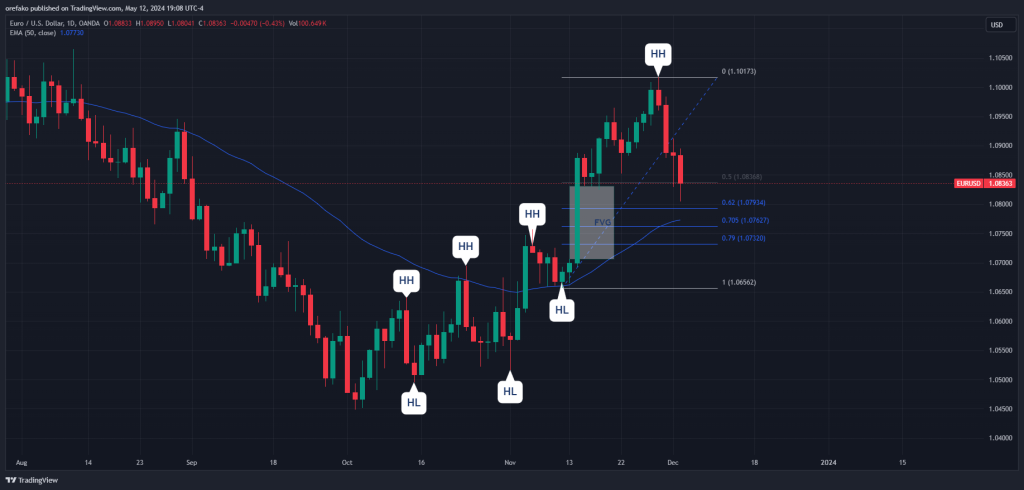
We then draw the Fibonacci tool with the OTE settings from the most recent low to the most recent high. Notice how our OTE coincides with a huge FVG roughly at the same level, confirming our trade.
Next, place a buy limit order at the 0.62 OTE level, which is the upper boundary. If you’re feeling good about your chances, you can lower the limit order to the 0.705 OTE level. Our stop loss is just underneath the most recent swing low, and our first profit target is the previous high.
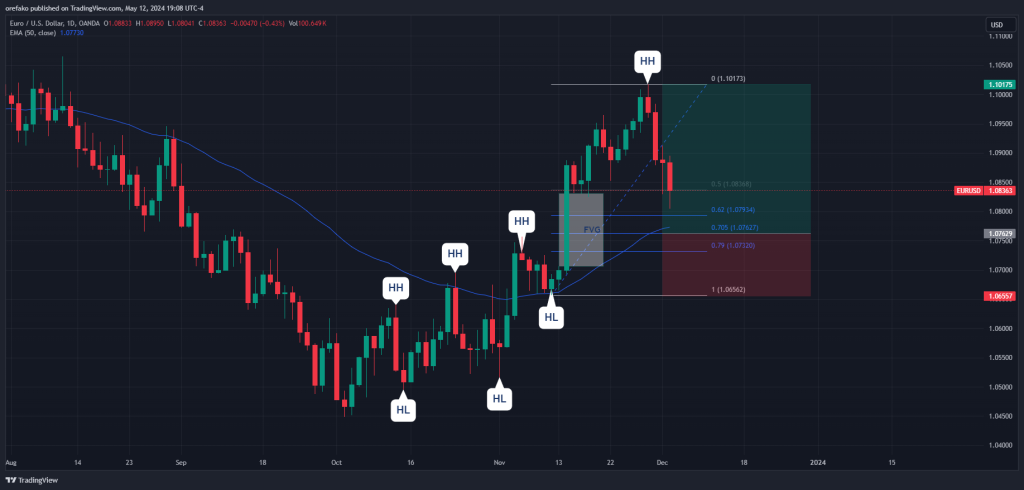
The chart below shows that the price dips into the OTE level and immediately rises to continue its trend.
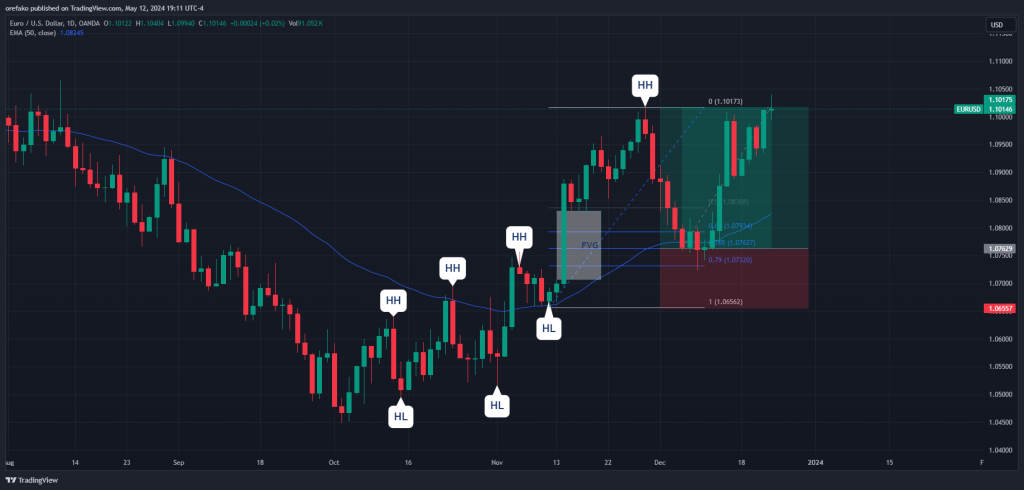
The advantage of using the OTE this way is that it simplifies things. You don’t need to worry too much about other complicated trading strategies or concepts. You just confirm the trend, map out your OTE, and then set a limit order in the direction of your trend. This concept helps you with your entry and exit points.
On the flip side, this strategy does not always guarantee trade entry opportunities. The price won’t always return to the OTE, so you’ll miss out on some chances using this method. Also, there’s no way to confirm that the price will hit your OTE level and reverse, which is what this next strategy attempts to tackle.
NOTE: The forex market is fractal, so chart patterns often replicate themselves across various timeframes. So, whether you’re into day trading or swing trading, the ICT OTE still works.
2. Combining the OTE With Other ICT Concepts
This second OTE trading strategy involves other ICT concepts. As a result, it can fit into any ICT trading strategy.
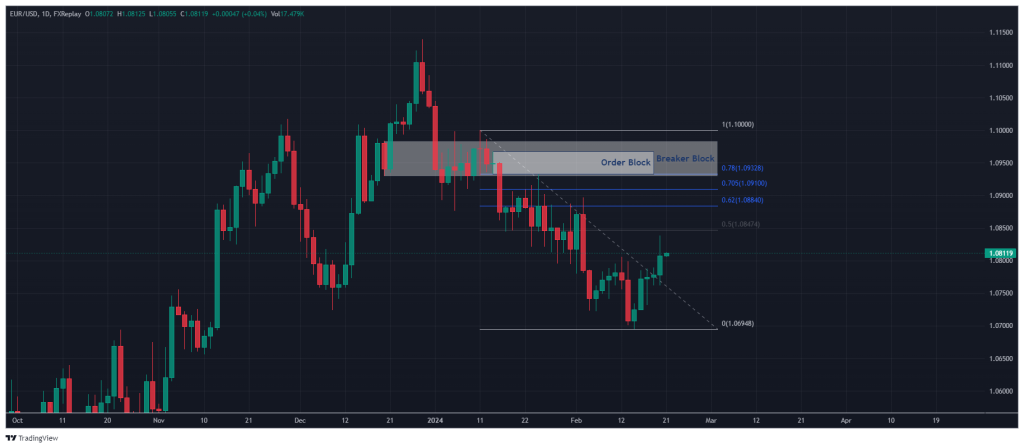
In the chart below, for instance, we plot the Fibonacci OTE on the EURUSD. The daily chart indicates a bearish market, characterized by a series of lower highs and lower lows.
Notice that this OTE coincides with a breaker block from the past and a more recent order block. These two extra ICT concepts add confluence to our OTE level. As the price retraces into this OTE zone, we dip into the hourly timeframe to scout trade entries.
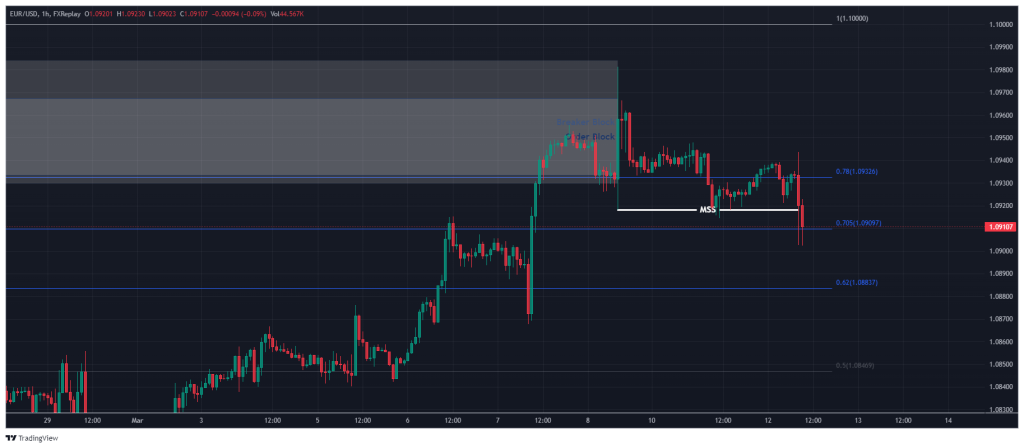
On the hourly chart, notice how a Market Structure Shift appears, confirming that the trend is indeed about to reverse at the OTE. Another confirmation is that the price first dipped into the order and breaker blocks, which tend to reverse the price.
What we do next is to simply get it on the trade. One way to do this is to wait for the price to retrace into the nearest FVG. Another way to enter a trade is to plot another OTE on this smaller timeframe and get in that zone. You could also identify another order block and place your trade there. There are so many ICT concepts and so many ways to use them.
For the sake of our example, though, we’ll simply enter the FVG that led to the Market Structure Shift. We’ll place our stop-loss at the top of the daily swing high, and our profit target will be the daily swing low.
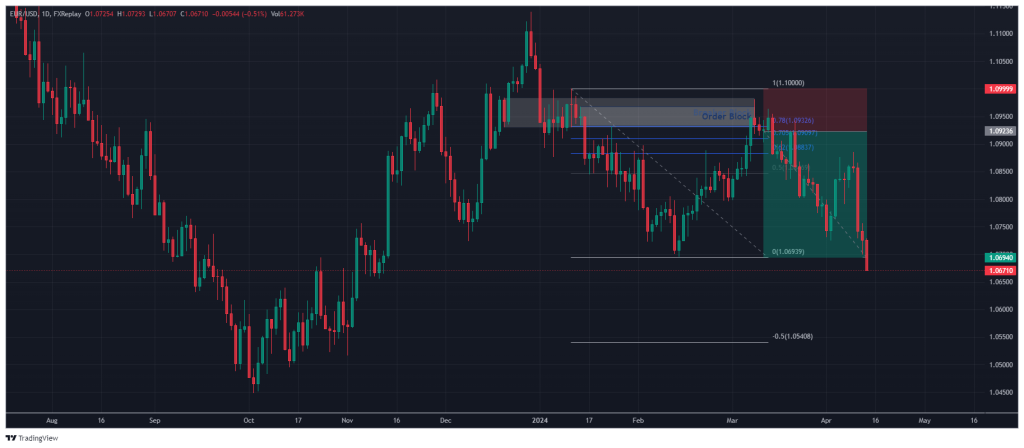
If you’re feeling aggressive, you can place your stop loss above the breaker block and target the daily swing low. This will give you a bigger risk-to-reward ratio, but your stop loss will be smaller. Your decision will depend on your risk management plan.
The Free Optimal Trade Entry Trading PDF
If you need something to easily refer to when you’re trading, here’s a concise optimal trade entry trading PDF. It’s free, by the way:
How Do You Learn the ICT Optimal Trade Entry?
The OTE is one of the most straightforward concepts in Inner Circle Trading. Yet, using it in isolation is not the best approach. You’ll need to learn and combine other ICT concepts with the OTE to get the best out of it. Even non-ICT trading strategies can work with the OTE.
To start with, here’s a list of 14 key ICT concepts you’ll need to know to help you get the best out of the OTE. That’s the first step you need to take to learn how to trade OTEs.
But you also need to remember that while ICT concepts can be easy to understand, they can be tricky to use on the chart. That’s why you should have a guide who can look over your shoulders as you learn to trade. Our resources about trading can give you the push not only to learn the basics of trading but also how to trade using smart money and ICT trading strategies.
Risk Disclosure: The information provided in this article is not intended to give financial advice, recommend investments, guarantee profits, or shield you from losses. Our content is only for informational purposes and to help you understand the risks and complexity of these markets by providing objective analysis. Before trading, carefully consider your experience, financial goals, and risk tolerance. Trading involves significant potential for financial loss and isn't suitable for everyone.


