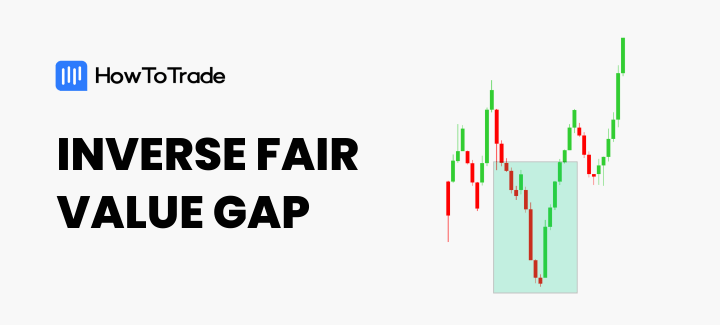
- Inverse Fair Value Gaps, or Inversion FVGS, are FVGs that get mitigated but remain valuable enough to hold the price in the opposite direction.
- Not all IFVGs on the chart are valid. But there are ways to spot the high probabilty IFVGs on your chart.
- IFVGs are most effective when used in conjunction with other ICT trading tools.
Mitigated fair value gaps are said to have failed, but they are not completely useless. They can still serve as demand or supply zones in the opposite direction. That’s exactly what the Inverse FVG is about. And in this blog post, we’ll show you:
- What an Inverse FVG is in the financial markets
- How to identify high probability IFVGs, and
- How to trade them.
 Table of Contents
- What is an Inverse Fair Value Gap?
- What are the Types of Inverse Fair Value Gap?
- How Do You Identify High Probability Inverse Fair Value Gaps?
- How to Trade the Inverse Fair Value Gap
- How to Use Inverse Fair Value Gap with Other ICT Concepts
- The Free Inversion Fair Value Gap Trading PDF
- What are the Benefits and Limitations of the ICT Inversion Fair Value Gap
- Final Thoughts
Let’s see how to use the inversion FVG to make informed trading decisions:
What is an Inverse Fair Value Gap?
An Inversion Fair Value Gap is an FVG that fails to hold the price. It’s a Fair Value Gap that was invalidated in one direction but remained valuable enough to hold the price as a supply or demand zone in the opposite direction.
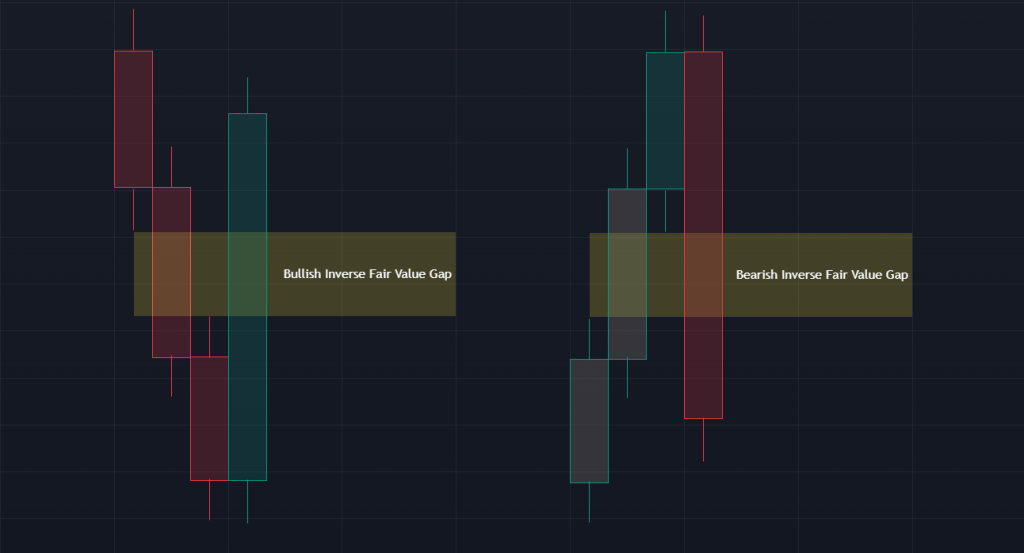
Usually, the price approaches this level from the other side as a new supply or demand zone. The most common use for this inversion fair value gap concept is as the first sign that a trend is coming to an end, especially when it’s used within the right context.
Another name for it is the Inverse Fair Value Gap.
What are the Types of Inverse Fair Value Gaps?
The Inversion FVG comes in two types:
1. Bullish IFVG
A bullish Inverse Fair Value Gap occurs when a bearish Fair Value Gap fails and gets invalidated by the movement of price through it to the upside. This level then serves as a demand level from which the price can make a bullish move.
2. Bearish IFVG
A bearish inverse FVG is a bullish Fair Value Gap that gets breached to the downside. This level then becomes a supply zone from which the price can make a bearish run.
How Do You Identify High Probability Inverse Fair Value Gaps?
Inverse fair value gaps can appear just about anywhere on the chart. And if you traded every single one of them as they appeared, you would blow up your trading account sooner than you would be profitable.
So, how do you identify the high probability Inverse Fair Value Gaps? When do you use the ICT Inverse Fair Value Gap?
1. Areas of Liquidity
Inversion Fair Value Gaps that appear after sweeps of liquidity tend to have a higher chance of holding the price. Liquidity, in this sense, can be in the form of:
- Daily highs/lows
- Session highs/lows
- multiple equal tops/bottoms
- Support and resistance zones
- or any lows and highs sticking out.
Be careful, though. You also need to understand the larger market context to make a good prediction of the high probability of IFVGs here.
For instance, if you’re on a bearish trend with lower highs and lower lows forming, the lower highs can serve as areas of liquidity that the price sweeps before continuing the bearish run.
2. Discount to Premium zones
Another way to spot high-probability inverse FVGs is to mark out premium and discount zones on your chart. In a bullish leg, the discount zone is the lower half of the leg, and the premium zone is the upper half. The idea behind premium and discount zones is that the price will likely retrace by at least 50% before it continues its trend. So, any supply or demand zone within the discount zone is more likely to hold the price.
But where does the IFVG come in here?
When the price taps into a supply or demand in the discount zone and creates an inverse FVG, this could be the first sign that a retracement is complete and that the trend is about to continue. Such IFVGs tend to be strong.
3. Failed Market Structure Shift
It is common for traders to dip into a lower timeframe when the price reaches its higher timeframe supply or demand level. They try to catch a market structure shift on this lower timeframe and then get in a trade on the FVG that formed during the market structure shift.
While the FVG can be a good entry point, it can also be a good inducement level for a farther away supply or demand if it fails to hold the price. So the FVG becomes an Inverse FVG that you can trade into a deeper level of your higher timeframe supply/demand zone.
How to Trade the Inverse Fair Value Gap
We’ll be showing you how to trade the Inversion Fair Value Gap using a GBPUSD example. Suffice it to say, the IFVG doesn’t have its own specific strategy. It’s merely a concept that you need to combine with others to make sense of the price.
Without further ado, here’s how to use the inverse fair value gap in your trading:
Step 1: Identify Sweep of Liquidity
The first thing to do is to recognize an area of liquidity that the price may sweep before continuing its trend. Preferably, you want the liquidity to be on the other side of where you expect the price to go so that the price can sweep it before delivering toward your direction.
For instance, you want the price to sweep sell-side liquidity first if you’re looking for a bullish price. Similarly, you want the price to sweep buy-side liquidity before the bearish distribution starts.
In our GBPUSD example, we expect the price to rise overall, considering we’re in an uptrend. However, we notice that the low sticking out is a potential sell-side liquidity.
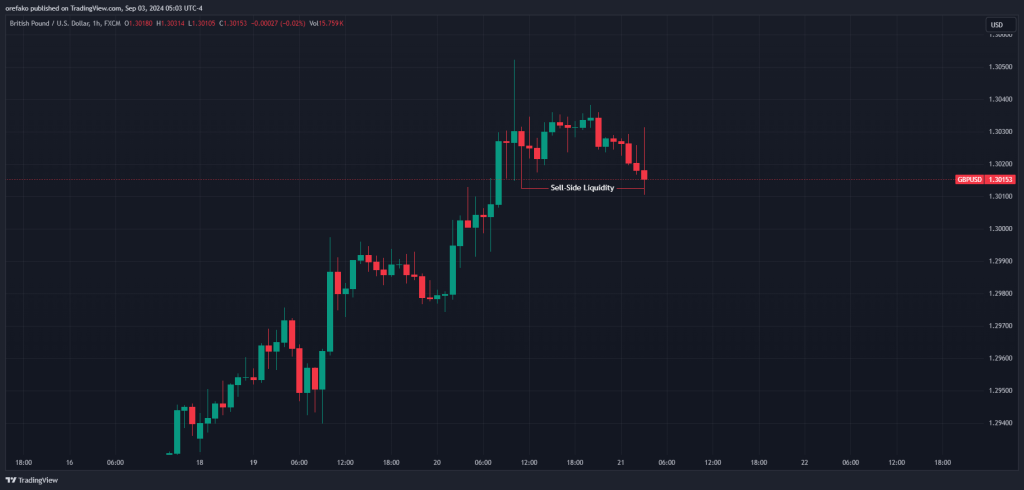
Once the price sweeps this area of liquidity, we enter the 15-minute timeframe to wait for a reversal in which an FVG is inverted.
Step 2: Trade Entry
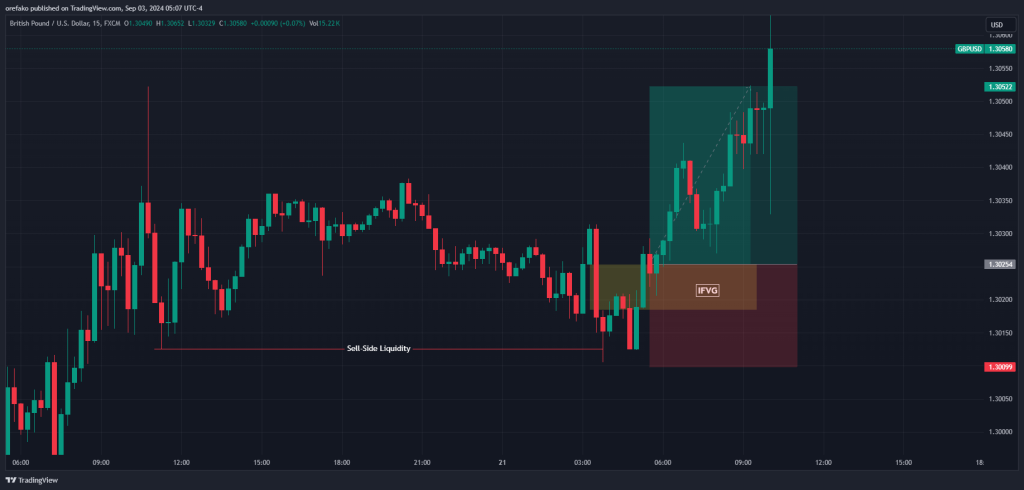
After the occurrence of the Inverse FVG, the aggressive method is simply placing a market order in the direction of your forecast. This entry method, however, comes at the expense of not getting the best risk-to-reward ratio, as your stop loss is likely to be far away from your entry.
Another entry method is to place your limit order on the side of the IFVG closer to the price. This way, you get tagged in when the price retraces, potentially offering you a better risk-to-reward ratio at the expense of missing out on the trade.
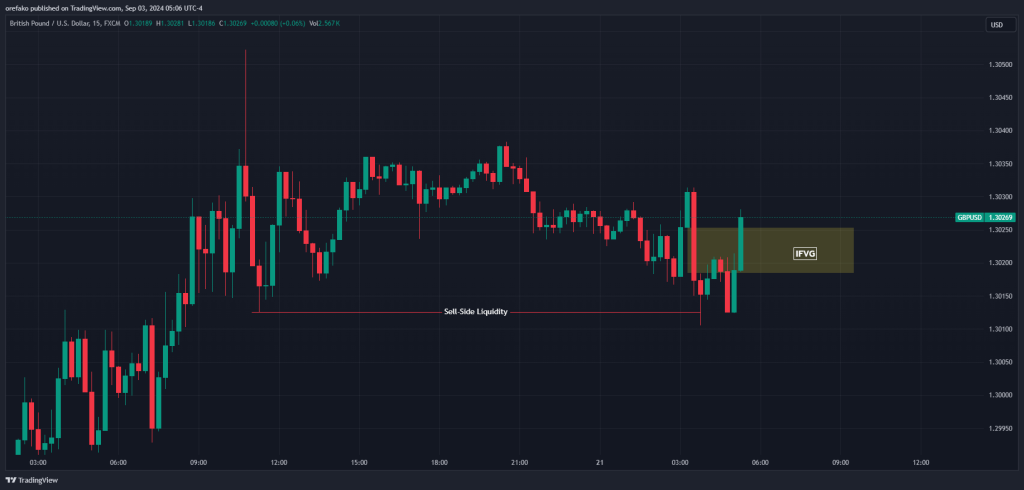
Of course, you can always await an extra confirmation before getting into the trade. But know that with every extra confirmation you wait for, the farther away the price gets from you and the higher your stop loss is likely to be.
Step 3: Risk Management
Your stop loss level should ideally be below the most recent low or high that formed before your IFVG. However, you can locate a deeper or higher swing point to place your stop loss around.
And for your profit target, you can be more flexible with this. You can use a simple risk-to-reward ratio or target a significant high or low on the other side of your trade. You can also locate the opposite side of liquidity and place your target on it.
How to Use Inverse Fair Value Gap with Other ICT Concepts
Let’s take a deeper look at the Inverse Fair Value Gap and how it relates to other ICT trading concepts using the same example we used in our simple Inverse Fair Value Gap trading strategy.
We’ll start from the daily timeframe and then go down to the lower timeframes until we take our entry on the 15-minute timeframe.
The Daily Timeframe
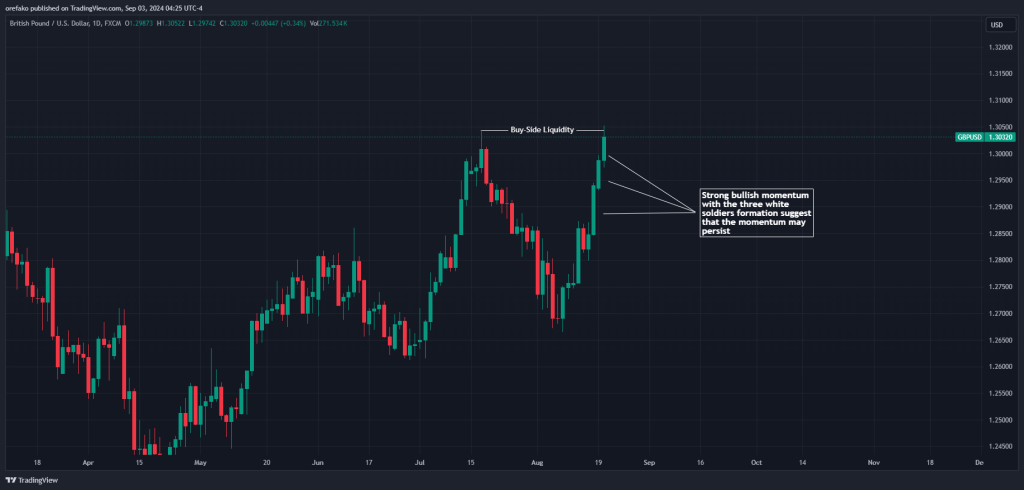
We noticed that we had just taken out a significant high during the daily timeframe. Significant highs are often liquidity areas where you expect the price to at least make some form of retracement before continuing the trend. But will this particular setup give us a reversal going into our trading day? We are not sure. There’s no way of knowing this.
But here are things to look forward to going into the trading day:
- Power of 3: The Power of 3 concept suggests that if we get a manipulation of the Asian Session range to the downside, we will likely distribute to the upside to clear the previous day’s high and continue the upward movement.
- The Bullish Momentum: The bullish momentum going into our trading day is quite strong, with the three white soldiers pattern even forming. This suggests that there may still be more upside movement left for us.
The Hourly Chart
The hourly chart shows the potential areas of liquidity that the price may first sweep before continuing its bullish trend (if it continues its bullish trend). We see the previous day’s high, two areas of sell-side liquidity, and the previous day’s low.
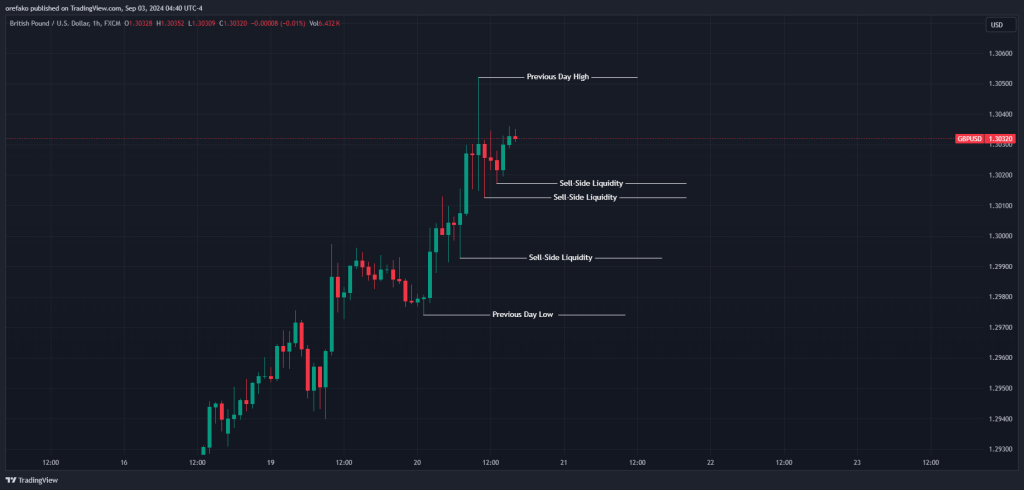
But how do you know which of these the price is likely to retrace into?
Simple. We mark out our Premium and Discount zones and pay attention to the liquidity levels in the discount zones. Although it is possible that the price just retraces within the premium zone before continuing its bullish trend, we would rather see a deeper retracement into a discount zone.
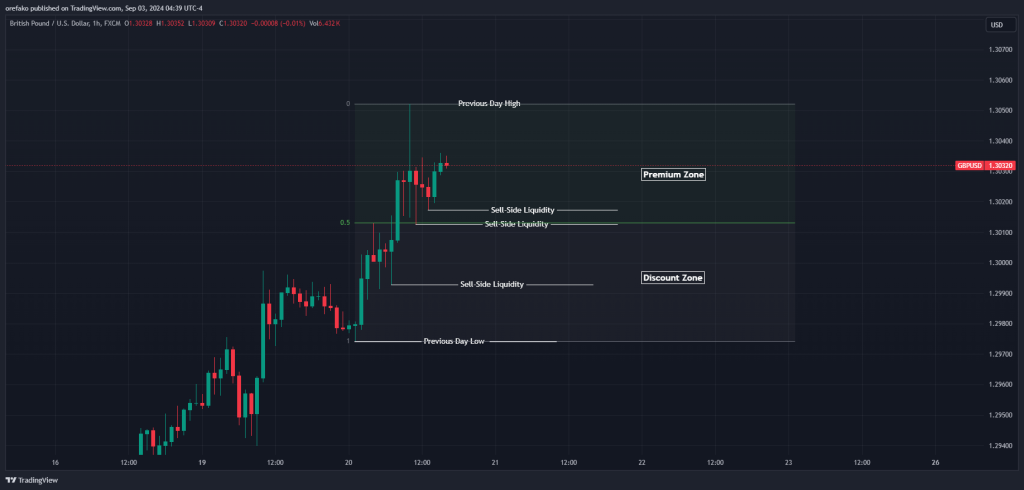
We notice that one “sell side liquidity” falls within the premium zone, and two others fall within the discount zone. While we’ll pay some attention to the first, we’ll be particularly interested in the other two because of where they fall into.
15 Minute Chart
Next, we go into our trading day to see how the price plays out. First, we see the price take out the first sell-side liquidity and reverse aggressively to create a market structure shift. We have also manipulated the Asian Range to the downside, so a distribution like the one we’re seeing is highly probable. Another thing we see is an FVG getting flipped to become an Inverse FVG.
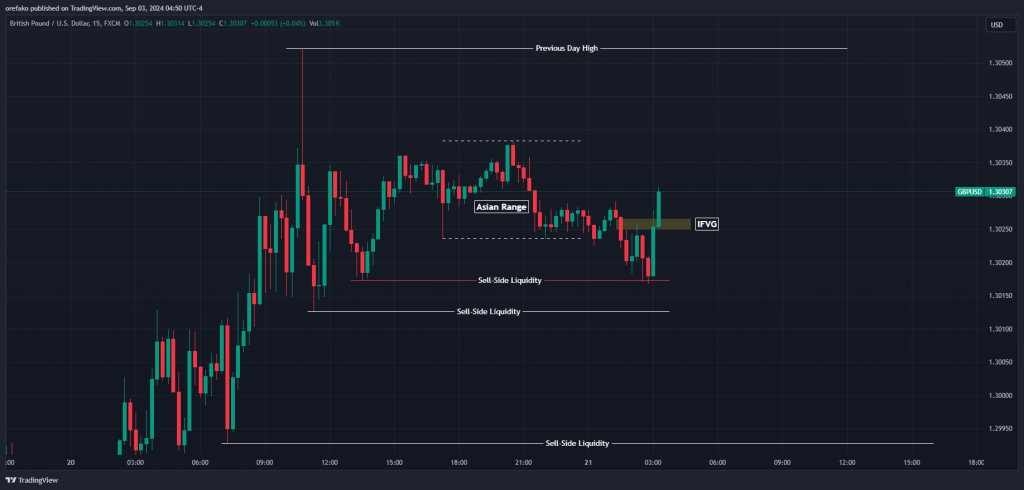
This would be a perfect example of our entry, but for one thing; this first sell-side liquidity is still part of the premium zone. This means there’s the chance for a deeper retracement, and we’re just seeing an inducement play.
What do we do? We wait. The price reverses almost immediately, so the market structure shift fails. It’s a good thing we waited because we soon clear the next sell-side liquidity, which is in our discount zone.
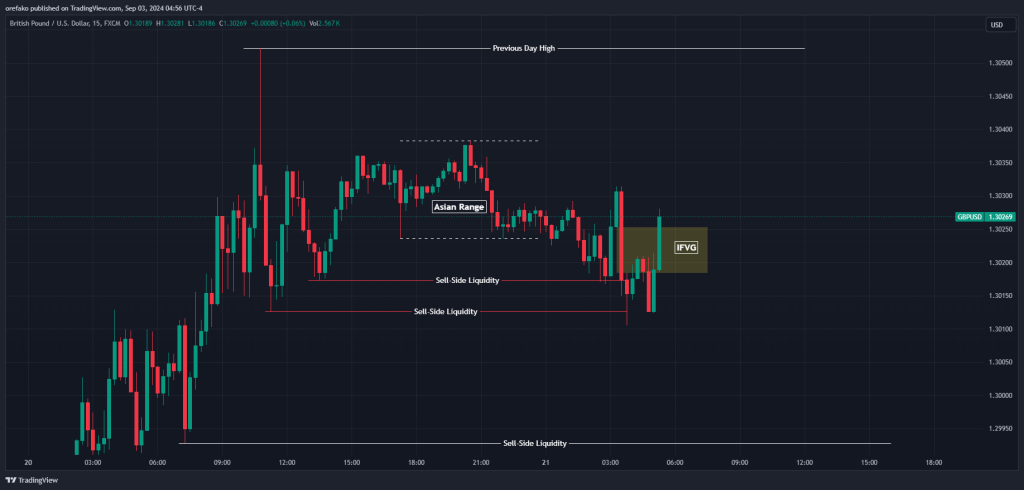
A new IFVG forms. This looks like a better entry because we are now coming from a discount zone. And what happens after this? The price retraces to our IFVG and then distributes to the upside to clear the previous day’s high. All of these happen in the London Killzone.
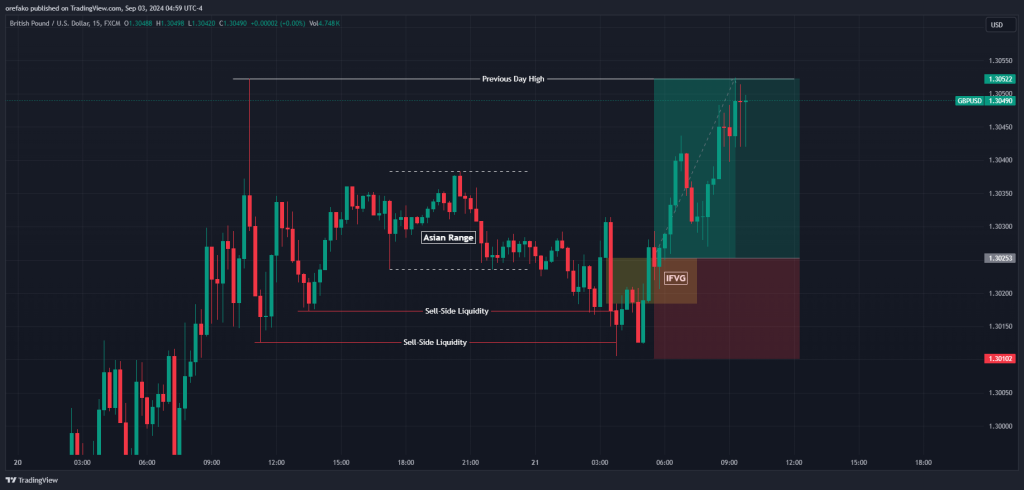
This is how you trade the Inverse Fair Value Gap with extra context from other ICT concepts.
The Free Inversion Fair Value Gap Trading PDF
If you need something to easily refer to when you’re trading, here’s a concise inversion fair value gap trading PDF. It’s free, by the way:
The Free Inversion Fair Value Gap Trading PDF
What are the Benefits and Limitations of the ICT Inversion Fair Value Gap?
The first benefit of the IFVG is that it is usually the first signal for a potential reversal point, allowing traders to enter trades at favorable market prices before a significant move in the opposite direction. As a result, traders can take advantage of early entry opportunities with relatively tight stops and substantial profit potential, enhancing the risk-to-reward profile of trades.
The immediate downside to this advantage is that not all IFVGs will result in successful trades. There can be false signals, especially in choppy or consolidating markets, leading to potential losses.
Another potential downside is that the broader market context can heavily influence the effectiveness of IFVGs. In highly volatile or erratic market conditions, the reliability of these gaps may diminish. If we’re being completely honest, though, the IFVG isn’t the only concept that suffers this downside. Other trading concepts, too, tend to fail in similar situations.
Finally, IFVGs should not be used in isolation. They work best when combined with other technical analysis tools, such as support and resistance levels, making them part of a broader trading strategy rather than a standalone solution.
Final Thoughts
Inverse Fair Value Gaps are a powerful concept in ICT trading that can help you get into trades early rough. However, it can also be a dangerous concept for the trade if used out of context. That’s why we recommend only taking the Inverse FVGs that appear in the areas we specified in this post.
Risk Disclosure: The information provided in this article is not intended to give financial advice, recommend investments, guarantee profits, or shield you from losses. Our content is only for informational purposes and to help you understand the risks and complexity of these markets by providing objective analysis. Before trading, carefully consider your experience, financial goals, and risk tolerance. Trading involves significant potential for financial loss and isn't suitable for everyone.


