- The Cumulative Volume Delta (CVD) is a technical analysis indicator that captures the interplay between buying and selling pressures in the market.
- CVD is a a valuable tool for understanding market dynamics, and supply and demand.
- The CVD indicator can be used for various purposes, including identifying market agressivness, trends and reversals, and get accurate trade signals.
The use of advanced trading tools like order flow and level 2 trading has become increasingly popular among retail traders and market participants. These tools offer valuable insights into market activities since they assist traders in knowing the traded volume and the market dynamics. One of the most effective tools is the cumulative volume delta (CVD), which we will explore in this guide.
Here’s what we will cover on this page:
- What is the Cumulative Volume Delta?
- How to Add CVD to TradingView or MT4/MT5
- How to trade with the Cumulative Volume Delta Strategy
What is Cumulative Volume Delta (CVD)?
The Cumulative Volume Delta (CVD) is a sophisticated trading tool that captures the interplay between buying and selling pressures in the market. Over time, CVD aggregates the difference in volume between trades executed at the bid and ask prices.
Each trade contributes positively or negatively to the cumulative total, depending on whether it is a buy or a sell. This running total reflects the overall market aggression and order flow, making it a valuable indicator for understanding market dynamics, as well as the supply and demand in the specific market.
In practice, CVD starts with a user-specified origin bar, which sets the initial point for accumulating volume differences. The cumulative delta value for each subsequent bar is added or subtracted from this origin, creating a cumulative measure. If the cumulative volume delta line trends upwards, it indicates a prevailing buying pressure; if it trends downwards, it reflects a selling pressure. This can signal potential price movements and help traders make more informed decisions.
One market in which the CVD is commonly used is the Bitcoin and cryptocurrency market. This is because crypto traders often look for clues regarding the market volume since the volume in cryptocurrency trading is still unclear due to the nature of the market. The cumulative volume delta of Bitcoin can be particularly useful for traders focusing on cryptocurrencies like Bitcoin. It helps identify trends and potential reversals by observing discrepancies between the volume flow (as measured by CVD) and price movements.
For instance, if the price of Bitcoin is falling but the cumulative volume delta on Bitcoin is rising, it might indicate underlying buying pressure that could lead to a price reversal.
How to Add CVD to Your Trading Platform – TradingView and MT4/MT5
Although using the cumulative delta indicator on platforms like ATAS and NinjaTrader is preferable because they can access live volume data from the market, traders can still use it on their favorite charting platforms, such as TradingView and MT4/MT5. Here’s how to install the indicator on these platforms:
TradingView
Adding the Cumulative Volume Delta (CVD) indicator to your TradingView charts involves a few straightforward steps:
- Open TradingView: Log into your TradingView account and open a chart for the asset you want to analyze.
- Access the Indicators Menu: Click on the ‘Indicators’ button at the top of the chart window to open the indicators menu.
- Search for CVD: In the search bar within the indicators menu, type “Cumulative Volume Delta” or “CVD”. You will see various CVD indicators created by the community or in-house.
- Choose an Indicator: Select the CVD indicator that best suits your trading style. Some versions will display histogram bars, while others might present more detailed intrabar data.
- Add and Configure: Click on the chosen CVD indicator to add it to your chart. You can further configure the settings, such as changing the color or the time intervals, to match your trading preferences.
- Interpret the Data: Understand that the CVD will appear on your chart, either below or directly on the price bars, helping you visualize the buying and selling pressure dynamically as the market moves.
Remember, the precision of the CVD data can vary depending on the settings you choose, typically the data is “More Precise” for shorter time frames and “Less Precise” for longer views.
MetaTrader 4/5 (MT4/MT5)
Adding the CVD indicator to your chart in MetaTrader allows you to analyze the balance between buying and selling pressure directly from your trading platform, providing valuable insights into market sentiment and potential price movements.
However, the Cumaltive Volume Delta indicator is not a built-in indicator on MT4/MT5, which means you must download the indicator on a third-party service. To add a custom CVD indicator to MetaTrader 4 or 5, follow these steps:
- Download the CVD Indicator: First, you need to obtain the CVD indicator file, which is typically provided in .mq4 or .ex4 format for MT4, or .mq5 for MT5. Ensure the file is compatible with your MetaTrader version. To do that, you must learn how to download and install custom indicators to MetaTrader4 and 5.
- Open MetaTrader: Launch your MetaTrader platform.
- Open Data Folder: In MetaTrader, go to ‘File’ and select ‘Open Data Folder’.
- Install the Indicator: Inside the data folder, navigate to ‘MQL4’ > ‘Indicators’ for MT4 or ‘MQL5’ > ‘Indicators’ for MT5. Copy the CVD indicator file you downloaded into this folder.
- Restart MetaTrader: Close and reopen your MetaTrader platform to refresh the indicator list.
- Attach the Indicator to a Chart: Open a chart for the asset you are trading, find the ‘Navigator’ panel, locate ‘Custom Indicators’, and you should see your newly installed CVD indicator. Drag and drop it onto the chart.
- Adjust Settings: Double-click the indicator to open its properties and adjust any settings to fit your trading strategy.
The Cumulative Volume Delta (CVD) is a sophisticated trading tool that captures the interplay between buying and selling pressures in the market. Over time, CVD aggregates the difference in volume between trades executed at the bid and ask prices.
Trading with the Cumulative Volume Delta Strategy
When trading using the Cumulative Volume Delta strategy, it is crucial to understand its applications in depth to harness its full potential in various trading scenarios. Here’s a detailed look into three critical aspects of trading with CVD:
1. Identifying Market Aggressiveness with CVD
CVD is pivotal in discerning the aggressiveness of buyers and sellers in the market. This indicator sums the volume of transactions executed at the bid price versus those at the ask price, providing a cumulative figure that shows whether buyers or sellers are more dominant.
Positive CVD delta values indicate momentum from aggressive buyers, suggesting an upward price momentum, while a negative CVD implies stronger selling pressure, potentially signaling a downward price movement.
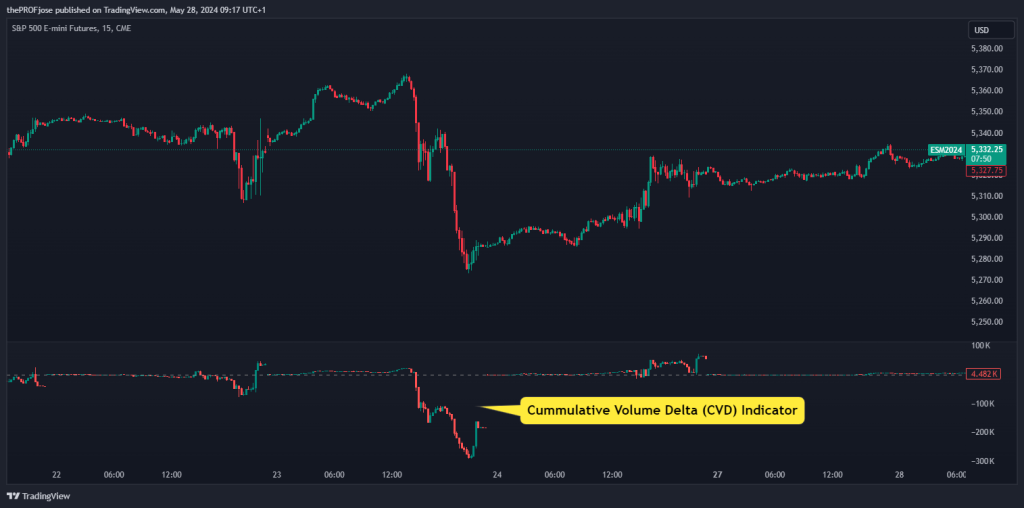
As you can see in the chart above, on platforms like NinjaTrader and TrdaingView, CVD is plotted as candlesticks beneath the price chart, providing clear visual cues about market dominance at any given moment. This information enables traders to adjust their positions according to the dominant market force. For instance, if a trader observes a consistently positive CVD during a trading session, consider positions that benefit from price rises.
Unlike other volume indicators, such as the VPT indicator or the Volume Profile indicator, which show the total volume in the market, the CVD presents the difference between buying and selling transactions. This can help traders identify anomalies in a specific market and identify when there’s strong buying or selling pressure. As a matter of fact, many traders use the CVD indicator to scan the markets, looking for assets with deviation in volume. While using CVD, they can find assets that are in a bubble mode or short-squeeze stocks, or… NVIDIA?
2. Confirming Trends and Reversals
CVD not only helps identify who is controlling the market but also confirms potential trend reversals or breakouts. This is particularly useful when the price action is ambiguous, a phenomenon known as divergence in trading.
For example, if the price is reaching new highs but the CVD is making lower highs, it could indicate that the buying pressure is not as strong as it appears, and a reversal might be imminent. This scenario, as seen in the S&500 chart below, is called a bearish divergence and is a crucial signal for traders looking to avoid false breakouts or position for potential reversals.
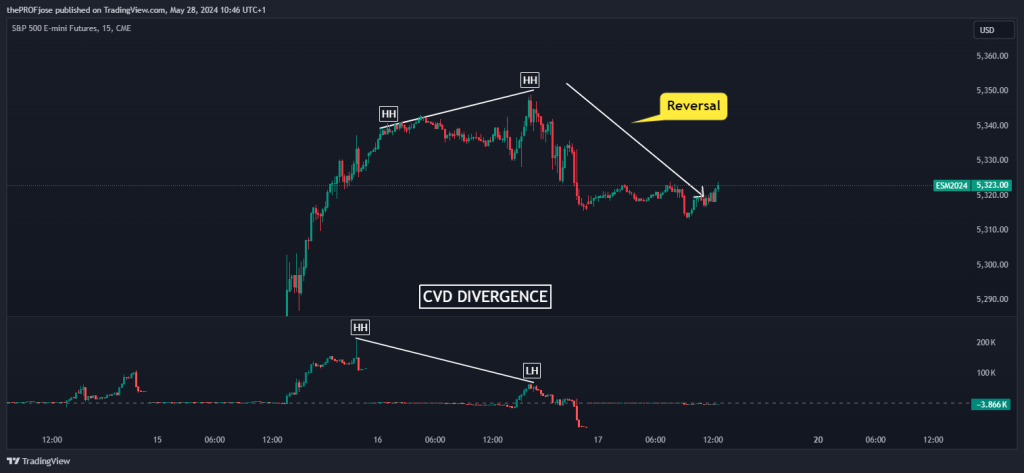
Conversely, a bullish divergence—where the price makes lower lows while CVD makes higher lows—suggests underlying buying interest that could precede a price recovery. These divergences are key in scenarios where the market’s direction is uncertain and can guide traders in making more informed decisions.
3. Volume Confirmation for Robust Signals
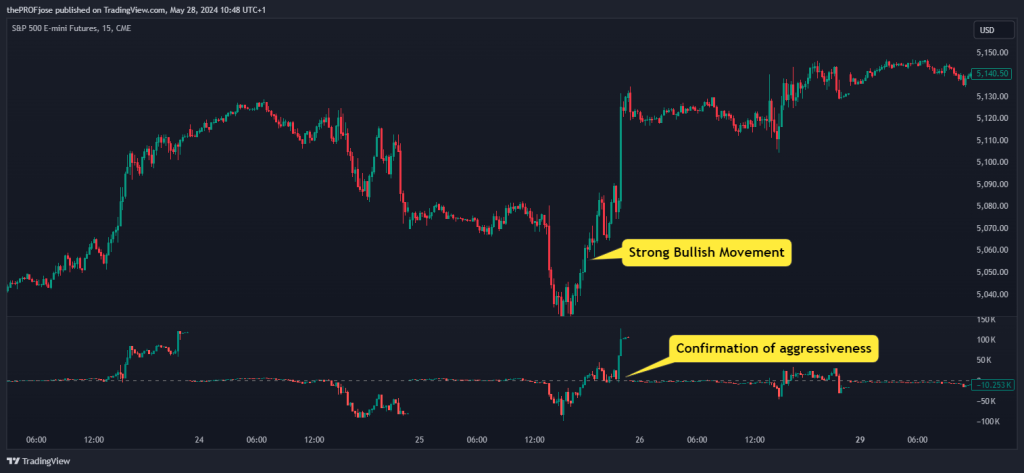
Integrating CVD with volume analysis enhances the robustness of the signals. High volume accompanying a positive CVD suggests a strong buying interest, which can be a reliable indicator of a sustainable upward trend.
Similarly, a high volume and a negative CVD indicate strong selling pressure. This combination is particularly effective in confirming the strength of market movements, providing traders with confidence in their trading decisions.
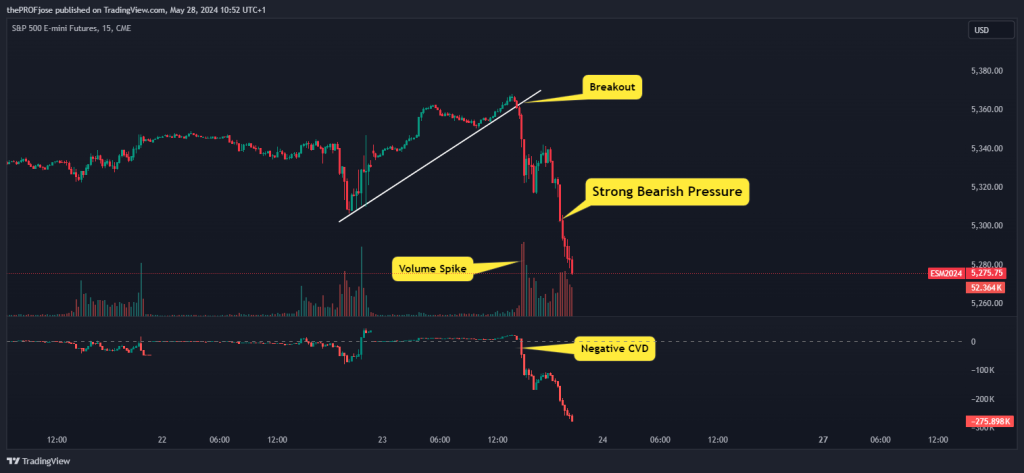
For instance, if the volume and CVD spike in the direction of the breakout during a price breakout, this confirms the move’s strength, suggesting it could be sustainable. The integration of CVD can be particularly effective for trend-following strategies, such as the trend trading strategy, the breakout trading strategy, and the opening range breakout (ORB) strategy.
Is the CVD Indicator Good for Day Trading?
Day traders find CVD invaluable because this indicator provides real-time insights into market dynamics. By observing the intraday changes in CVD, traders can detect sudden shifts in market sentiment that may not be immediately obvious from price action alone. For example, if the CVD shows a sudden positive increase while the price also begins to climb, it might indicate a surge of buying interest, which could be a good entry point for a long position.
Moreover, CVD’s real-time aspect helps traders capture quick profits by entering and exiting trades based on the shifts in buying or selling pressure indicated by the CVD. In that sense, the CVD is an ideal technical analysis indicator for scalp traders. Platforms like Sierra Charts or NinjaTrader, which provide detailed customization and real-time analysis of CVD, are beneficial in managing these quick trades effectively.
Check out our daily market analysis page for insights about leading FX pairs, global indices, and commodities.
Over to You
In sum, the cumulative volume delta indicator provides a clear picture of buying and selling pressures through volume analysis, which helps traders pinpoint market trends, anticipate reversals, and precisely validate market movements. Many perceive CVD as the ideal volume analysis indicator, particularly for short-term trading styles.
To truly leverage CVD’s potential, we encourage traders to incorporate this indicator into their analysis. Whether you prefer TradingView’s adaptability or MetaTrader’s robust features, adding the CVD indicator to your toolkit can elevate your market analysis, offering real-time insights that are crucial for making informed trading decisions. It is advisable to use other technical analysis indicators to help you confirm any generated CVD trade signals.
So, start by backtesting trading with this tool and practicing with a demo account before actually committing your personal funds to trading the cumulative volume delta strategy.
Risk Disclosure: The information provided in this article is not intended to give financial advice, recommend investments, guarantee profits, or shield you from losses. Our content is only for informational purposes and to help you understand the risks and complexity of these markets by providing objective analysis. Before trading, carefully consider your experience, financial goals, and risk tolerance. Trading involves significant potential for financial loss and isn't suitable for everyone.