While not the most popular, the Half Trend indicator is a simple and effective tool that could be the key to unlocking your forex trading potential. Its straightforward approach to calling trading signals can instill confidence in your trading decisions, especially if you’re a beginner trader.
- The Half Trend indicator is a strong trend telling tool
- The indicator uses color changes and arrows to give clear buying and selling opportunities
- The best time to use the Half Trend indicator is when the market is making clear trend moves, either upward or downward.
In the rest of this piece, you’ll learn what the Half Trend indicator is and how to use it in your trading. You’ll also learn about the Half Trend strategy and the best settings for your trading.
 Table of Contents
- What is the Half Trend Indicator?
- How is the Half Trend Indicator Calculated?
- How to Use the Half Trend Indicator
- Half Trend Indicator Trading Strategy
- What are the Benefits and Limitations of the Half Trend Indicator?
- What is the Best Setting for the Half Trend Indicator?
- What’s the Difference Between the Half Trend and the Supertrend Indicators?
- Bottom Line
What is the Half Trend Indicator?
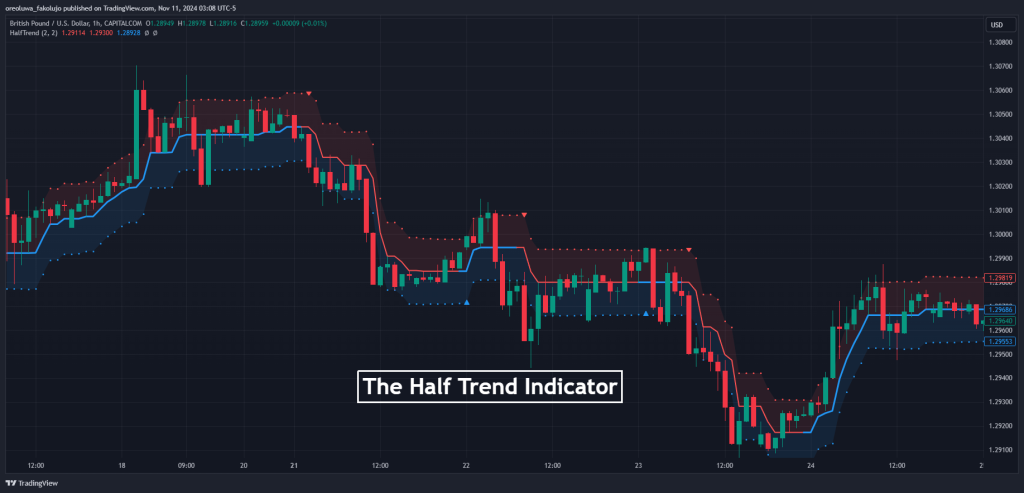
The Half-Trend indicator is a technical trading tool used to identify trend direction and potential reversal points. Its ultimate aim is simple: to clearly identify entry and exit signals.
On the chart, the Half Trend indicator appears as a line, which often changes color based on the trend direction: one color indicates an uptrend, and another shows a downtrend. It also has dots that form upper and lower boundaries. Some other variations of this indicator will even have a histogram rising and falling from the line instead of the dots. But do not worry; the middle line is the main focus.
This simplicity, perhaps, is why its fans swear by it. You simply buy when the indicator signal goes blue and sell when the indicator signal goes red. In case that isn’t clear enough, the indicator’s signals come in the form of blue and red arrows. The blue arrow tells you when to buy, and the red arrow tells you when to sell. However, it’s important to remember that, like most trend-following indicators, the Half Trend performs best in clear trending markets and may produce false signals in sideways or highly volatile markets.
How is the Half Trend Indicator Calculated?
We’ll be honest and say we don’t know much about how the Half Trend Indicator works. We do know, however, that it uses multiple moving averages and some smoothing techniques to keep its signals steady and reduce noise.
Is it just another Moving Average indicator, then? Maybe. Maybe not. However, the advantage of the half trend over other moving average indicators is that it combines the strength of the long-period moving averages with the strength of the short-period moving averages.
The longer-period moving averages only change signals once in a while because it takes a while for the price to get to them and cross over them. As a result, they can help you avoid losses from quick false movements. The shorter-period moving averages get really close to the price action, helping you catch as many moves as possible. However, they fall for false price fluctuations a lot.
The Half Trend, however, retains a closeness to price action that the short-period moving averages have, helping you spot more trading opportunities. It also has the resistance to price fluctuations peculiar to the long-period moving averages so that sudden price fluctuations don’t cause it to change signals erratically.
How to Use the Half Trend Indicator
Two main ways the Half Trend indicator is used are trend identification and trade entry and exit.
Trend Identification
Trend identification with the Half Trend indicator is quite simple. If the indicator line is blue, the trend is bullish. And if the indicator line is red, the trend is bearish. Depending on the trading platform or the indicator maker, yours might not be red and green. Regardless, one color signifies a bullish trend, and the other signifies a bearish trend.
Having said that, though, there’s one more way to identify consolidations using the Half Trend indicator.
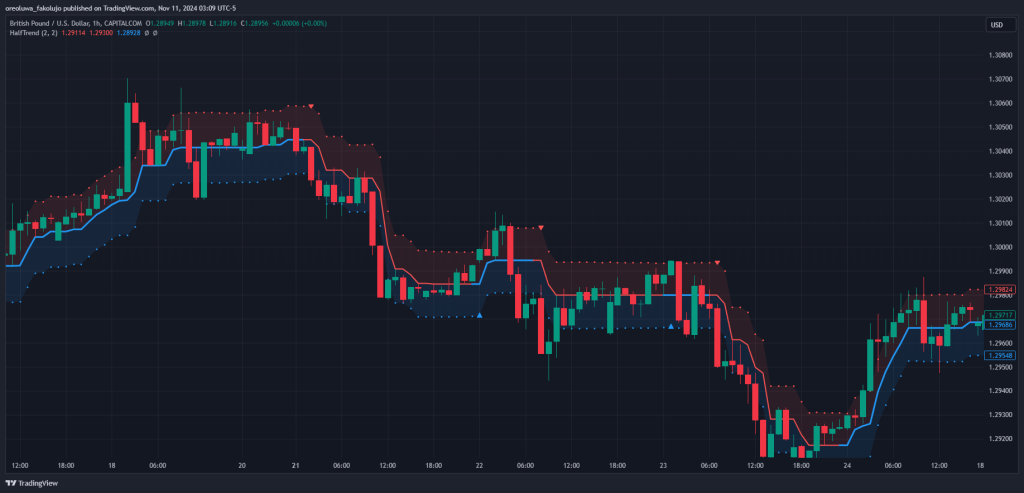
If the indicator does not have an obvious slope for a while, like in the image below, this usually is a sign that the price is consolidating.
Trade Entry and Exit
Entering and exiting trades is just as simple as identifying the trends. You simply enter a bullish trade when the indicator gives you a buy signal and exit when the indicator gives you an opposing signal.
For instance, if you take a short trade when the indicator line turns red, you exit the position when the indicator turns blue. Similarly, if you take a long position when the indicator has the blue line, you exit your trade when the indicator gives the red line. You can also use the indicator’s signal arrows for this purpose.
Half Trend Indicator Trading Strategy
The Half Trend Indicator is very easy to trade. For the sake of our example, we’ll combine our Half Trend indicator with the Exponential Moving Average, but this is not a rule. You can combine yours with the Relative Strength Index or other technical tools. Just try to combine it with other tools.
Trade Setup
The Half Trend indicator is one of the easiest to trade. You simply wait for the indicator to give the signal and execute. The turning of the midline to red indicates a sell, and the turning of the indicator to blue indicates a buy.
However, to ensure that we buy only when the trend is bullish and sell when the trend is bearish, we’ll add the 50 EMA to the chart to guide our trend bias.
Trade Entry
We get a proper bearish trade entry when the Half Trend indicator crosses the 50 EMA to the downside. And we get a bullish signal when the indicator crosses the 50 EMA to the upside. We don’t take it whenever we get a Half Trend signal that opposes the 50 EMA trend.
For instance, let’s look at the USDJPY chart on the daily timeframe. Notice how we buy when we get a bullish crossover.
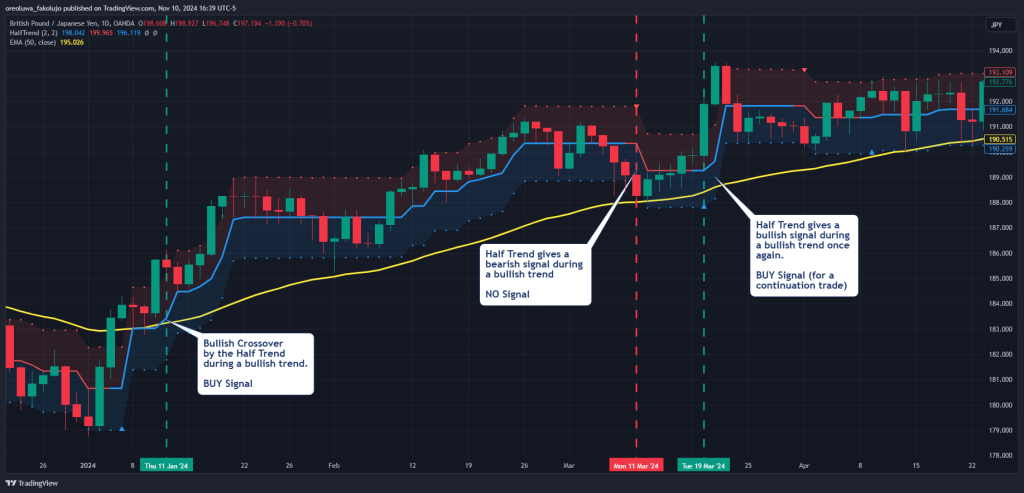
Also, notice that the Half Trend turns bearish somewhere in the middle of the bullish trend. We don’t take this trade, but it’s an opportunity to get in on a continuation trade. We will do that as soon as the Bias of the Half Trend matches the trend again.
Risk Management
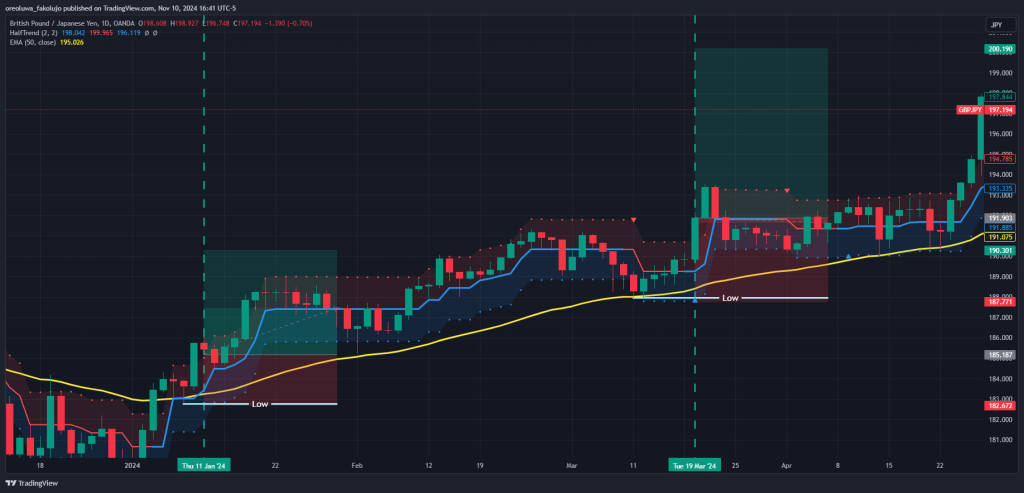
Your stop loss in a bullish trade should be below the most recent swing low. And in a bearish trade, place it above the most recent swing high.
There are two ways to take your profit from trades like this. The first is to simply wait for a bullish crossover after a bearish trend or a bearish crossover after a bullish trend. While this method can help you ride very long trends to their ends, it can make you end up with losses if the indicator suddenly changes signals.
The second profit-taking method is to set a risk-to-reward ratio of a minimum of 1:1. This trade exit method can help you secure profit quickly, especially when consolidating price action.
For the sake of our example, we use a simple 1:2 risk-to-reward ratio as our profit target.
What are the Benefits and Limitations of the Half Trend Indicator?
The Half Trend indicator does one thing well: the telling of the overall trend. It sticks to the price without being susceptible to price fluctuations in a way that other moving averages struggle to manage. And that has got to be its first advantage.
Another benefit of the Half Trend indicator is its clear and unmissable signals on the chart. The color change of the middle line is the signal, making it easy for even beginner forex traders to spot trade opportunities and feel reassured in their decisions.
The indicator is not perfect, though. For one, it has the same problem that almost every other indicator has: its lagging nature. It calculates its current signals from its past price signals. As a result, it is rather slow to react to huge moves. And by the time the indicator gives its signals, it may be too late in some cases.
What is the Best Setting for the Half Trend Indicator?
The Half Trend indicator works just fine at its default settings. But if you want something different, that would depend on what you’re trying to do. If you want the indicator to be more sensitive to price movements, you can reduce the Amplitude, which is 2 by default. If you want to expand the dots that serve as the boundary to the indicator, then you can increase the Standard Deviation, which is 2 by default as well.
What’s the Difference Between the Half Trend and the Supertrend Indicators?
The Supertrend indicator is very similar to the Half Trend indicator. They both tell trends, and they are very easy to use. However, one of the major differences between them is the way they are calculated.
For the Half Trend, we don’t know exactly how it is calculated. However, we know it has some elements of the Exponential Moving Average and some smoothing technique. The Supertrend, on the other hand, has the Average True Range indicator as its main component.
The Exponential Moving Average is one of the simplest to use, yet powerful indictors out there. We have three posts with three different trading strategies for the EMA. Take your trading to the next level with these EMA trading strategies:
8, 13, 21 EMA Strategy for Intraday Trading [2025 Guide]
The 9 EMA – A Powerful Trading Strategy for Short-Term Traders
How to Use the 20 EMA Trading Strategy (in 3 Easy Steps)
Another key difference is that the Supertrend, at its default setting, is a tad less sensitive to price movement than the Half Trend.
So, which should you use? The Half Trend or Supertrend? Since the Supertrend is less sensitive, it can be used for longer trends. The Half Trend, on the other hand, reacts quickly to the market and can be used to catch shorter trends. That said, you can combine them both using the Supertrend for confirmation and the Half Trend for precision entries.
Final Word
The Half Trend indicator offers more reliable signals on markets or assets that tend to have a lasting, strong trend. Regardless of what market you’re trading it on, though, make sure to combine the indicator with other tools for extra confirmation.
Risk Disclosure: The information provided in this article is not intended to give financial advice, recommend investments, guarantee profits, or shield you from losses. Our content is only for informational purposes and to help you understand the risks and complexity of these markets by providing objective analysis. Before trading, carefully consider your experience, financial goals, and risk tolerance. Trading involves significant potential for financial loss and isn't suitable for everyone.


