


The Coppock Curve indicator is an oscillator based on momentum that identifies long-term trading opportunities in the market. It typically combines the rate of change on two different periods and evaluates the weighted moving average of the combination.
- The Coppock Curve is a momentum indicator designed to help traders identify the market’s long-term buy and sell signals.
- It is mainly used as a long-term trading tool, usually on the weekly and monthly time frames.
This guide will take you through the Coppock Curve indicator and how it works. Most importantly, we’ll show you how to use it to enhance your trading strategies.
So, let’s get right into it.
What is the Coppock Curve Indicator?
The Coppock Curve is a technical analysis indicator that smoothens the rate of change of asset price. This enables traders to spot a new trend in the market and get into trades easily following a significant drop in price. Essentially, it’s a momentum indicator developed in 1962 by renowned economist, Edwin Coppock, to help long-term stock traders get into a bullish trade after a bearish run. However, nowadays, it is used by not only long-term stock traders.
Interestingly, history has it that Coppock sought after the average grieving period after a loss from the Episcopal Church in his days. The Church suggested it was between 11 and 14 months after a loss. This made him come up with the 14-month and 11-month rate of change involved in its calculation. And with that information, he came up with this indicator that aims to predict the rise of price from a bearish run.
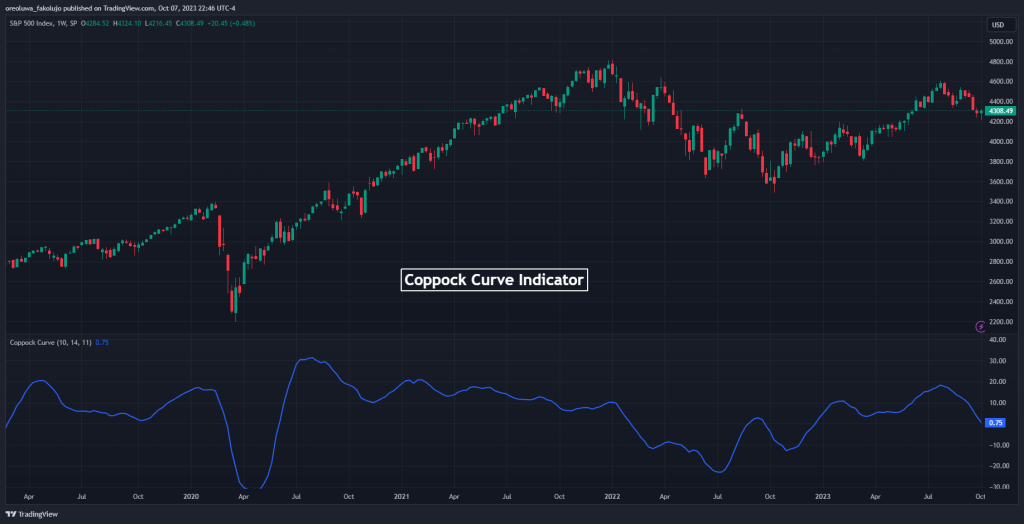
As you can see, the Coppock Curve is a subchart indicator, displaying below the price chart as an oscillator that trends upwards and downwards about a zero level. The default setting of the indicator is a Weighted Moving Average period of 10 and two Rate of Change periods of 14 and 11. However, altering this value leads to an oscillator that is more or less sensitive to price fluctuations.
How the Coppock Curve Indicator Works
To achieve its primary aim of providing a bullish signal after a bearish run, the Coppock Curve indicator evaluates the 10-period Weighted Moving Average of the sum of an 11-month and 14-month rate of change of asset price.
In other words, Edwin Coppock, after determining the average grieving period after loss of between 11 and 14 months, firstly evaluates the sum of the rate of change of asset price over 11 periods and the rate of change over 14 periods. He thereafter plotted a 10-period weighted moving average of the derived sum. The new 10-period smoothing gives rise to a curve that oscillates above and below a zero level on the indicators chart.
More explicitly, the formula for the Coppock Curve indicator is as follows.

Where;
WMA = Weighted Moving Average ( 10 by Default)
ROC = Rate of Change of asset price
Practically, readings above the zero line suggest a bullish trend is in place, and traders often go long. When the Coppock Curve crosses below the zero line, it indicates a bearish trend where traders go short.
How to Use The Coppock Curve Indicator in Trading
You’ll probably cannot find many more indicators simpler in their use than the Coppock curve. The indicator oscillates from a positive to negative territory. On TradingView, you only need to slap a horizontal line at the 0-level of the indicator to spot crossovers easily.
A bullish crossover of the Coppock Curve is your bullish signal, and a bearish crossover of the indicator is your bearish signal. Originally, Edwin Coppock only used this indicator to trade signals. However, many analysts have used the indicator to also catch bearish trades.
Another way to use the Coppock Curve is as a confirmation tool for other technical trading tools or indicators. This way, you can confirm your trend with the Coppock while using any other tool to call your trade signals.
At last, one other way to use the Coppock Curve is to trade divergences. This is, perhaps, a blessing of all oscillating indicators. A divergence occurs when the indicator forms swing highs and lows that don’t correlate with the price’s swing highs and lows.
For instance, you have bullish divergence when the price forms lower lows while Coppock forms higher lows. You also get the same signal when the price price forms a higher low but the oscillator forms a lower low. Conversely, you have a bearish divergence when the price forms higher highs and the indicator offers lower highs instead. And finally, you also get a bearish divergence when the price shows a lower high but the indicator gives a higher high.
It’s important to note that divergences don’t always work. Sometimes, the price just continues in the same direction without following the bias of the divergence. Still, when used correctly, many traders succeed in using divergences to spot trading opportunities.
Coppock Curve Indicator Trading Strategy
In this section, we’ll show you a simple trading strategy using the Coppock Curve indicator. We’ll use it the way the designer used it; only taking bullish trades.
Trade Setup
First, open your Coppock Curve on your price chart. If you’re on TradingView, the indicator will not come with a horizontal line to mark the 0-level. However, you can simply add it yourself. This way, you’ll spot the Coppock line crossovers more easily.
Once you have the Coppock Curve indicator, you have a bullish signal whenever the indicator crosses the zero line to the upside.
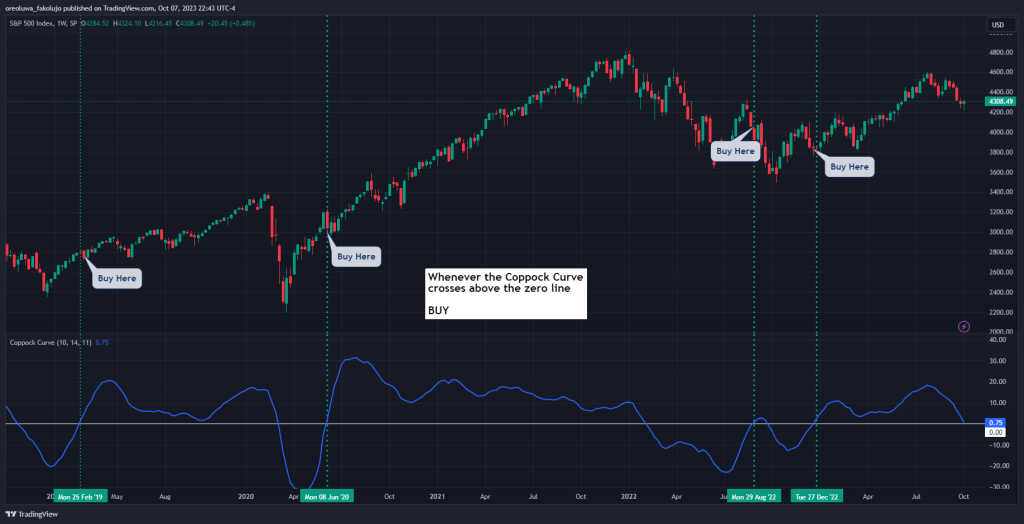
As you can see, the S&P500 chart above has the Coppock Curve on it. And every time the indicator crossed above the zero line, we took a bullish trade.
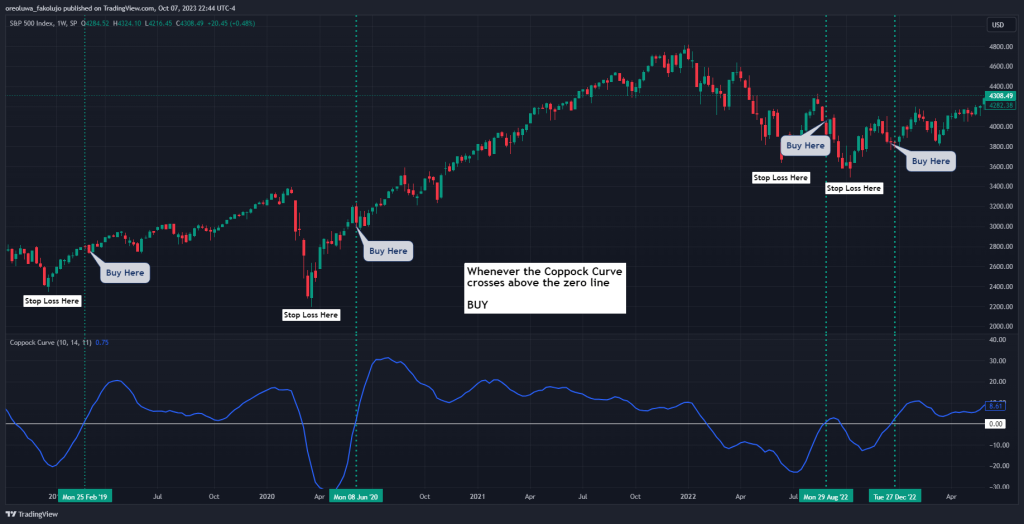
Stop Loss and Take Profit
Next, to properly manage your trade, you need to set a stop loss and take profit orders. Your stop loss will be just beneath the most recent swing low, and you’ll take your profit when the indicator dips below the zero line.
Having described the Coppock Curve strategy, it’s important to note that it can also be used as sell signal triggers. In fact, the indicator gave a sell signal before the 2008 stock market crash on the S&P500. A trader may have escaped the crash if they had paid attention to the indicator then. And of course, the sell signals are generated when the line falls below the zero-level.
Coppock Curve Indicator- Pros and Cons
So far, in our discussion, you may have encountered some of the perceived benefits and challenges associated with the Coppock Curve Indicator. Indeed, the indicator is very helpful for confirming new trends and establishing existing ones. It gives traders a broad perspective on the overall trend in a market. However, it poses enormous challenges when using it on much smaller timeframes. We discuss some benefits and limitations of the Coppock Curve below.
Benefits of Using the Coppock Curve Indicator:
The Coppock Curve is a very efficient tool for trend trading for traders on the weekly and monthly timeframe. It is also possible to filter out false signals when combined with other relevant indicators. Some benefits of the Coppock Curve are highlighted below.
Pros
- The Coppock Curve is excellent for identifying long-term trends, making it a valuable tool for long-term investors and swing traders.
- The indicator provides clear signals when it crosses the zero level, making it very straightforward for traders.
- The weighted moving average reduces noise in the signal, making it less susceptible to false signals.
- The indicator works efficiently with other technical indicators, providing deeper insight into the market dynamics.
Limitations of the Coppock Curve Indicator
It is very easy to ponder on the usefulness of the Coppock Curve indicator if you are neither a swing trader nor a long-term investor. The indicator breaks down in efficiency when you try to fit it into smaller timeframes. That is a significant setback for the tool. That and some other limitations are highlighted below.
Cons
- The Coppock Curve is not ideal for intraday traders or those looking for short-term opportunities.
- It is also a lagging indicator, meaning it is heavily reliant on historical price data and may take time to catch a trend reversal.
- Although it produces fewer false signals than other indicators, this is only because it generally makes fewer signals. It is, therefore, still prone to false signals at a similar rate compared to many other indicators.
Key Takeaways
- The Coppock Curve is a momentum indicator designed for long-term trading.
- It is calculated using a weighted moving average of the 14-month and 11-month rates of change.
- Traders use it to identify long-term bullish and bearish signals.
- A simple trading strategy involves buying when it crosses above the zero line and selling when it crosses below it.
- Consider using the Coppock Curve with other trading tools for confirmation and risk management.
Frequently Asked Questions About the Coppock Curve Indicator
The following are some of the most frequently asked questions about the Coppock Curve Indicator.
Is the Coppock Curve Indicator available on TradingView?
The Coppock Curve indicator is available on popular trading platforms like TradingView. Traders can easily launch it onto their charts and may choose to customize it to preferred settings. On MetaTrader 4&5, the indicator is available as a customer indicator, which means you must manually download and install the indicator on MT4/5.
What are the best settings for the Coppock Curve Indicator?
The default settings for the Coppock Curve indicator of 10- Weighted Moving Average, 14- and 11- Rates of Change are often suitable for most traders. However, you may experiment with different settings to align with your trading strategy and timeframe. Some traders may choose to adjust the length of the rates of change or the length of the weighted moving average to fine-tune the signals.
What is the difference between RSI and Coppock Curve?
While the Relative Strength Index (RSI) indicator is used primarily to identify overbought and oversold conditions in the market, the Coppock Curve is used to determine long-term bullish and bearish trends. The RSI generates signals at the 70 and 30 levels, while the Coppock Curve generates signals by a cross of the zero level and is less concerned with overbought and oversold conditions. Finally, RSI is effective for short to medium-term trading and is often used on daily and hourly charts. Coppock Curve is mostly used on weekly and monthly charts.
Risk Disclosure: The information provided in this article is not intended to give financial advice, recommend investments, guarantee profits, or shield you from losses. Our content is only for informational purposes and to help you understand the risks and complexity of these markets by providing objective analysis. Before trading, carefully consider your experience, financial goals, and risk tolerance. Trading involves significant potential for financial loss and isn't suitable for everyone.


