One oscillator that doesn’t get the attention it deserves from traders is the Chande Momentum Oscillator. Its major strength is in the way it’s calculated.
- The Chande Momentum Oscillator measures the momentum of an asset by adding recent gains and subtracting recent losses over a specified period.
- It can be used as a divergence trading tool, an overbought and oversold instrument, and a trend-continuation indicator
- Unlike many other momentum indicators where more weight is given to upward or downward movements, the CMO gives a balanced perspective of the strength of the price movement
Let’s see what this Chande Momentum Oscillator is, how it is calculated, how to use it, and how to trade it.
 Table of Contents
- What is the Chande Momentum Oscillator?
- How to Calculate the Chande Momentum Oscillator
- How to Use the Chande Momentum Oscillator
- The Chande Momentum Oscillator Trading Strategy
- What are the Benefits and Limitations of the Chande Momentum Oscillator?
- What’s the Difference Between the Chande Momentum Oscillator and Stochastic Indicators?
- What is the Best Time Frame or Setting for the Chande Momentum Oscillator?
What is the Chande Momentum Oscillator?
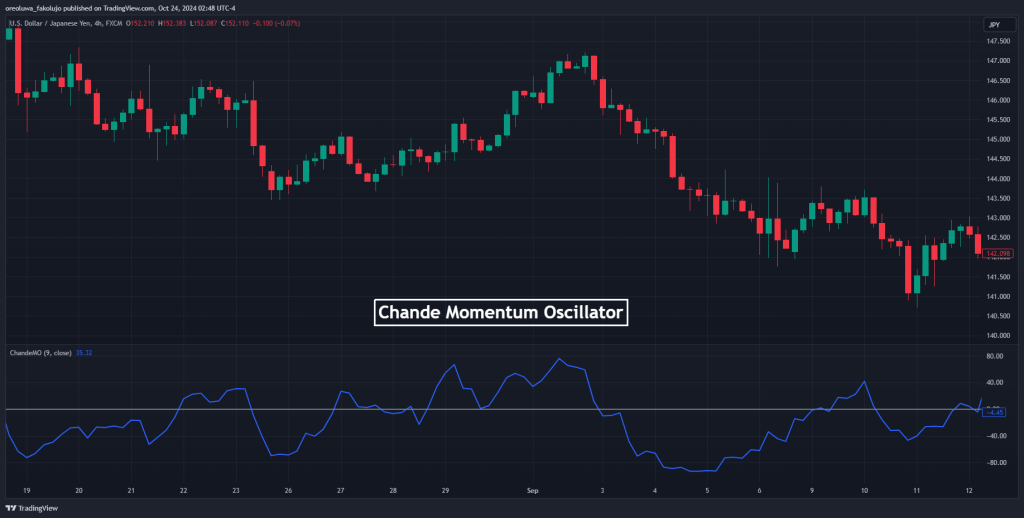
The Chande Momentum Oscillator (CMO) is a technical indicator developed by Tushar Chande in 1994. It measures the momentum of an asset by adding recent gains and subtracting recent losses over a specified period. The result is an oscillator that goes from +100 to -100, unlike traditional oscillators like the Relative Strength Index (RSI), which goes from 0 to 100.
The CMO gives you insight into price movements, overbought and oversold conditions, reversals, or continuation patterns. A key feature of the CMO is that it considers both up and down price movements equally, so it’s more balanced in its momentum approach.
How to Calculate the Chande Momentum Oscillator
The Chande Momentum Oscillator indicator is relatively simple to calculate. It uses the most recent data on gains and losses to measure the momentum of an asset.
The indicator considers the sum of gains and losses over your chosen period. If the closing price for a period is higher than the previous closing price, it’s considered a gain. If it’s lower, it’s considered a loss. By default, the period is 9.

The result will oscillate between +100 and -100, indicating the strength of momentum.
While it’s good to understand how the CMO is calculated, most modern charting platforms will automatically compute it for you. However, knowing the formula can give you a deeper understanding of how the indicator reacts to price changes when to use it, and how to use it.
How to Use the Chande Momentum Oscillator?
The Chande Momentum Oscillator (CMO) is a versatile tool used to identify momentum shifts, overbought or oversold conditions, and potential entry or exit points in trading. Here’s how traders can make the most of this indicator:
1. Overbought and Oversold Conditions

The Chande Momentum Oscillator (CMO) is a bounded momentum oscillator. As a result, you can use it to determine overbought and oversold levels. When the CMO goes above +50, it means the asset is overbought. The price has moved too far too fast, and a pullback could be expected. And when the CMO goes below -50, it means the asset is oversold. Selling pressure may have been exhausted, and a rebound could be expected.
You should know, though, that trend trumps overbought or oversold conditions. So, you should give more weight to the trend of the market than the indicator when considering overbought or oversold trades. One way to go about it is to only take oversold trades when the price is in a bullish trend. Conversely, only take overbought trades when the price is in a bearish trend.
2. Divergence Trading
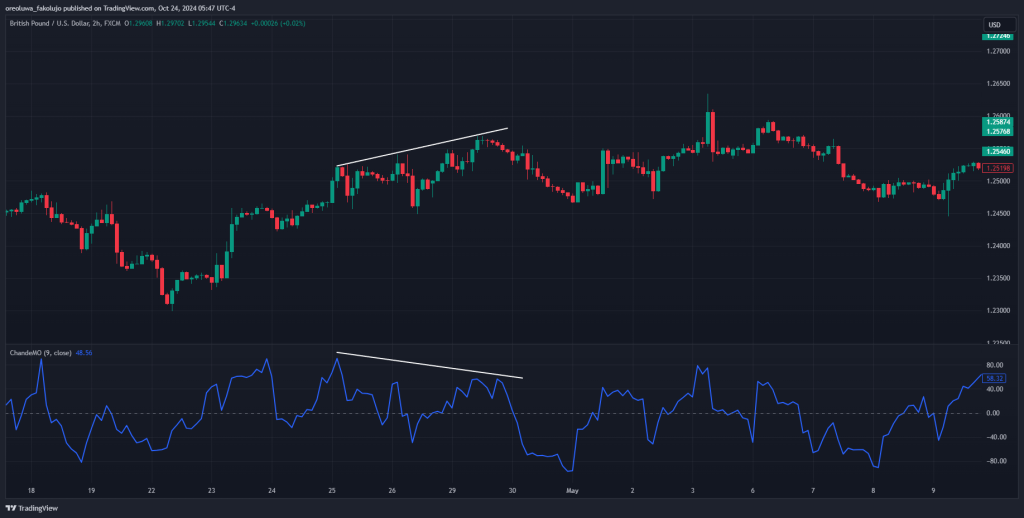
Divergence occurs when the price of an asset moves in the opposite direction of the CMO. For instance, we get a bullish divergence when the price forms a lower low while the CMO forms a higher low. This suggests that the downward momentum is weakening, and the price may soon rise. Similarly, we get a bearish divergence when the price forms a higher high while the CMO forms a lower high, suggesting that the upward momentum is weakening. And soon, you may find the price falling.
3. Zero Line Crossover

The zero line is neutral and can signal momentum shifts. When the CMO crosses above the zero line, upward momentum is gaining strength and could be a buying opportunity. Conversely, when CMO crosses below the zero line, it means downward momentum is increasing, which could be a selling opportunity. This zero-line crossover can be used to determine the overall trend direction.
Chande Momentum Oscillator Trading Strategy
The Chande Momentum Oscillator is very easy to trade, thanks to the way it delivers its signals with simplicity. In this section, we’ll combine it with the 9-21 Exponential Moving Average strategy. The 9-21 EMA will be our trend confirmation tool, while the CMO will generate trading signals.
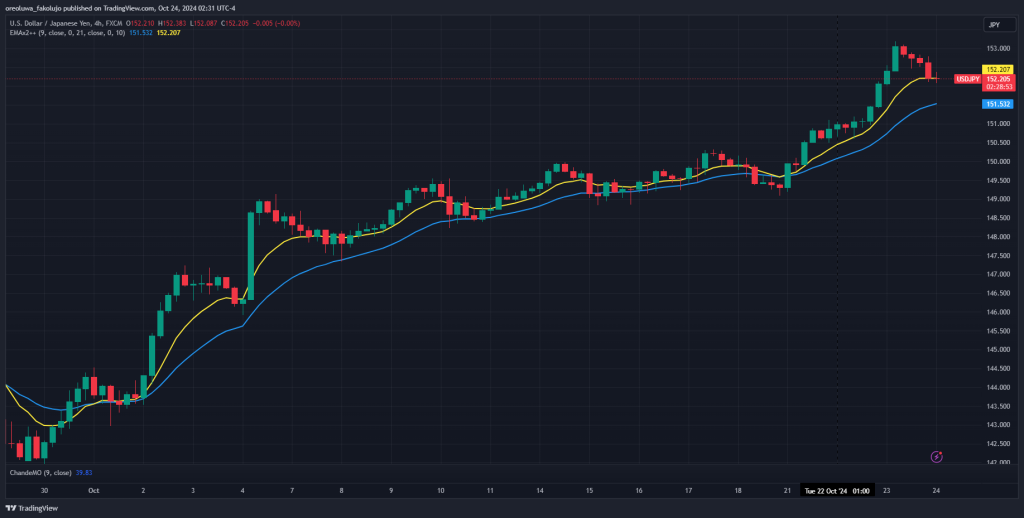
We’ll take an example from the USDJPY chart on the 4-hour timeframe.
We recommend using this strategy on assets and higher timeframes where trends tend to last longer. Anything from the 4-hour upward will do. This is also why we chose the USDJPY 4-hour chart.
Trade Setup
Place the 9 and 21 EMAs on the chart alongside your CMO. You don’t need two EMAs for the 9 and 21 EMA. You only need a single multi-EMA indicator that you can configure to give you the 9 and 21 EMAs.
Once you have this, the double EMA will confirm our trends. That is, when the 9 EMA crosses above the 21 EMA, we are in a bullish trend. And when the 9 EMA crosses below the 21 EMA, we’re in a bearish trend.
In our USDJPY example, for instance, we’re in a bullish trend. The 9 EMA (yellow line) is above the 21 EMA (blue line).
Here’s where the CMO comes in.
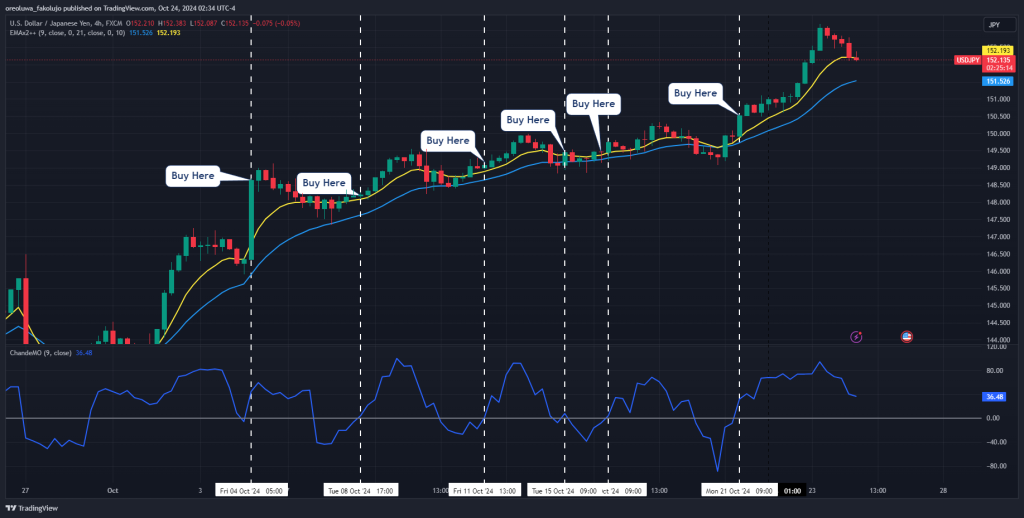
Whenever the signal line crosses the zero line to the downside on the CMO while the trend is bearish, you sell. And whenever we cross the zero line to the upside on the CMO, we buy. Otherwise, you wait.
Trade Management
Place your stop loss below the most recent swing low. Only target a simple 1:2 risk-to-reward ratio. Another way to exit is to close all bullish positions when the 9 EMA crosses the 21 EMA to the downside. Don’t forget that this means we’re not bearish. Similarly, close all open bearish trades when the 9 EMA crosses the 21 EMA to the downside
Going back to our USDJPY example, notice how we place our stop loss at the bottom of every recent swing low, and we aim for our 2R.
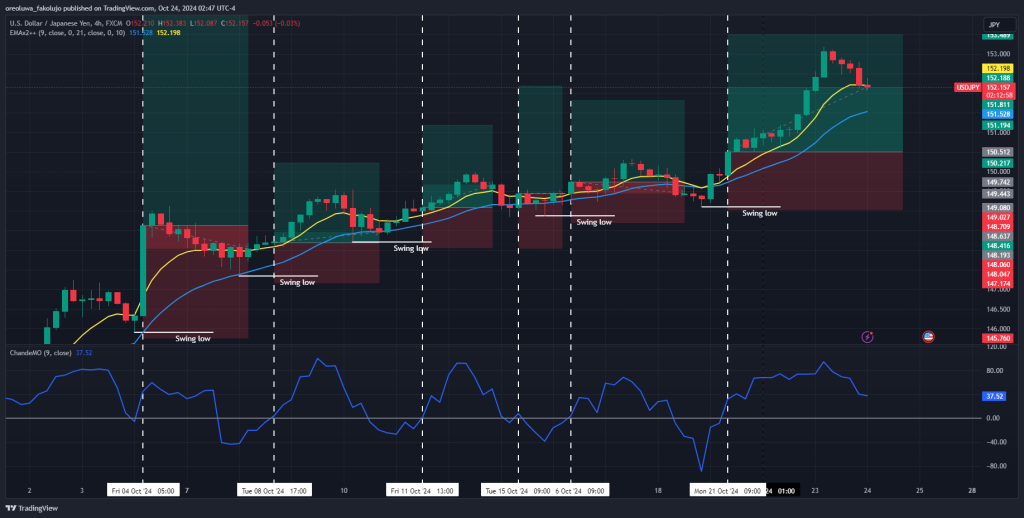
Of all the six trades we took, only two would still be running as of the time of this writing. The other four have reached our profit target. If 9 EMA flips the 21 EMA to the downside, though, we close all open trades.
What are the Benefits and Limitations of the Chande Momentum Oscillator?
Unlike other oscillators that may focus more on positive or negative price movements (such as RSI), the CMO gives equal weight to gains and losses. This provides a balanced view of momentum, making it a more reliable tool for traders looking for comprehensive momentum analysis.
Another advantage of the CMO is its versatility. You can apply the indicator to different markets and timeframes, making it suitable for a wide range of trading strategies, from day trading to long-term investing.
One more thing the CMO indicator has going for it is that it’s easy to use. A new technical trader can pick it up and understand how to use it with ease.
On the flip side, the CMO is a lagging indicator. It uses past data to generate its signals. As a result, it’ll always only react to the market movement, which may cause you to miss out on opportunities.
Another potential disadvantage is that the indicator is susceptible to false signals in choppy markets. And for traders who don’t know how to manage risks in these times, it could mean the blowing of accounts.
What’s the Difference Between the Chande Momentum Oscillator and Stochastic Indicators?
The Chande Momentum Oscillator (CMO) and Stochastic Indicators are popular tools for assessing market momentum. And because they’re oscillators, traders use them in pretty much the same way. That is, they trade overbought/oversold conditions, divergences, and zero-line crossovers with them. However, the indicators differ in their calculation and how they gauge the market conditions.
For instance, the CMO gives equal weight to upward and downward movements. This way, it gets a more balanced view of the overall momentum. The Stochastic, on the other hand, only focuses on where the price of an asset is compared to a specified range. As a result of this, the difference in calculation between both indicators makes the CMO more stable and less susceptible to price fluctuations than the Stochastic.
What is the Best Time Frame or Setting for the Chande Momentum Oscillator?
We recommend that you use the CMO at its default on the higher timeframes where trends are surer and tend to last for longer. Also, choose trading instruments that have a habit of trending for long to maximize accuracy. The USDJPY and EURCHF are perfect examples of such trading instruments.
That said, you can always tweak the indicator to fit into your trading strategy.
Bottom Line
The Chande Momentum Oscillator gives you a balanced perspective of the changes in price. However, it is not supposed to be used as a standalone tool. Combine it with other technical indicators to get the best out of it.
Risk Disclosure: The information provided in this article is not intended to give financial advice, recommend investments, guarantee profits, or shield you from losses. Our content is only for informational purposes and to help you understand the risks and complexity of these markets by providing objective analysis. Before trading, carefully consider your experience, financial goals, and risk tolerance. Trading involves significant potential for financial loss and isn't suitable for everyone.


