- The Strat is a comprehensive trading strategy focusing on candlestick patterns and market trends analysis for recognizing potential market movements.
- It emphasizes the importance of inside and outside bars, time frame continuity, and broadening formations for predicting market trends and reversals.
- By offering a structured, non-emotional approach to trading, the Strat charting system is ideal for beginner traders.
Emotional trading is one of the major reasons why most traders struggle to become profitable. Thankfully, Rob Smith discovered how to read price action in a logical and non-emotional way and dubbed it “The Strat.” This trading technique has gained some popularity over the past few years.
In this article, we will present you with a general overview of what the Strat is all about, its purpose, key concepts, and principles, and how to use it to level up your analysis. Let’s dive right into it.
- What is the Strat Trading Strategy?
- Understanding Strat Chart Patterns
- Decoding the Structure of Strat Patterns
- What is the Purpose of Using the Strat Trading Technique?
- Strat Multiple Time Frame Analysis
- The Free Strat Trading Strategy PDF
- What are the Benefits and Limitations of Strat Trading?
- Does the Strat Trading Method Work?
- Frequently Asked Questions About Strat Trading
What is the Strat Trading Strategy?
The Strat, developed by experienced trader Rob Smith, is a multifaceted trading strategy rooted in the analysis of candlestick patterns to understand market trends and potential reversals. This approach is not just about recognizing a singular pattern but involves a comprehensive understanding of a set of distinct multi-candle patterns that signal various market movements. Each pattern is a combination of specific candle patterns (usually 2-3 candlesticks), which, when read together, provide insights into the continuation or reversal of market trends.
Trading The Strat requires not just pattern recognition but also a deep understanding of the context in which these patterns occur, making you see the need to analyze the broader market trends, consider multiple time frames, and look for continuity to confirm the direction of the pattern.
According to the Strat theory, by analyzing repetitive candle patterns, traders can easily find lots of trade opportunities without the need for other trading tools. It’s an intuitive strategy in which a trader learns a variety of patterns that can provide accurate entry and exit points.
Key Elements of Strat Chart Patterns
Like traditional chart patterns, the Strat trading strategy hinges on the principle that market movements can be distilled into simple, identifiable patterns, empowering traders to make informed decisions based on these insights. The idea is the same, but the Start trading technique focuses on other chart pattern formations.
Here are some key elements of the Start trading methodology:
1. Inside and Outside Bars
A key aspect of Strat trading is recognizing and interpreting inside and outside bars. An inside bar candle pattern, characterized by its body and shadows being completely engulfed by the previous candle, can signal either a potential trend continuation or reversal. In contrast, an outside bar, marked by higher highs and lower lows compared to the preceding bar, indicates increased volatility and the potential for trend reversals or market expansions. An inside bar indicates that the market is likely to move in the same direction as the first bar, while an outside bar signals that the market is likely to move in the direction of the second candle.

Overall, outside and inside bars are an extremely vital part of the Start technique. Memorizing these patterns is also pretty straightforward.
2. Full-Timeframe Continuity
Time frame continuity is another pivotal element in Strat trading. It involves analyzing different timeframes to assess the strength and direction of a trend. Full-time frame continuity, where all relevant time frames align in a single direction (either bullish or bearish), often presents high-probability trading opportunities.
For instance, we have full-time frame continuity when the most recent weekly candle is strongly bullish, and the 4-hour and daily charts of the current week are already showing a bullish market structure.
3. Broadening and Contracting Markets
Broadening and contracting formations within the Strat patterns are vital to recognize. According to the Strat theory, the identification of broadening and contracting markets can provide a strong indication of the price movement. Here’s an example of a broadening price action behavior.
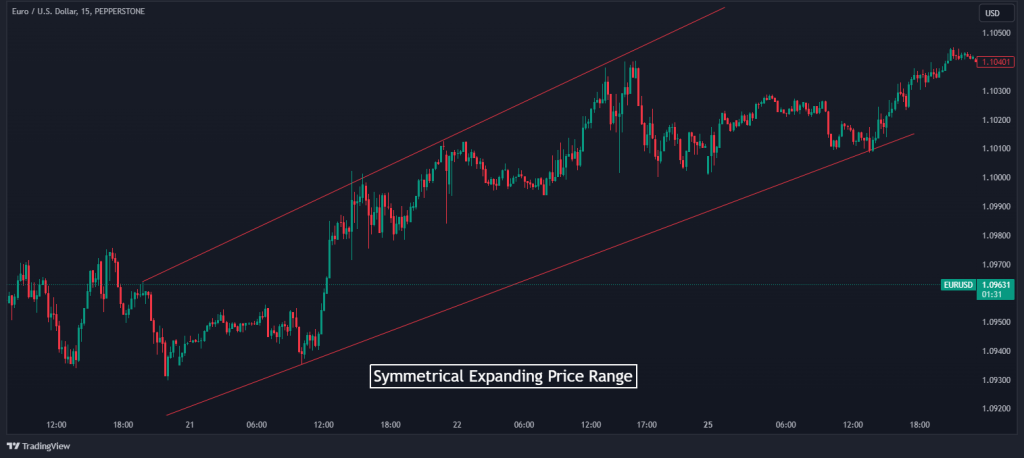
These broadening formations, marked by increasing price swings and expanding price ranges, can be either symmetric or asymmetric. Either way, they play a crucial role in signaling potential trend reversals. As the price action expands, traders should remain vigilant for possible reversals or breakouts.
4. Directional Bars
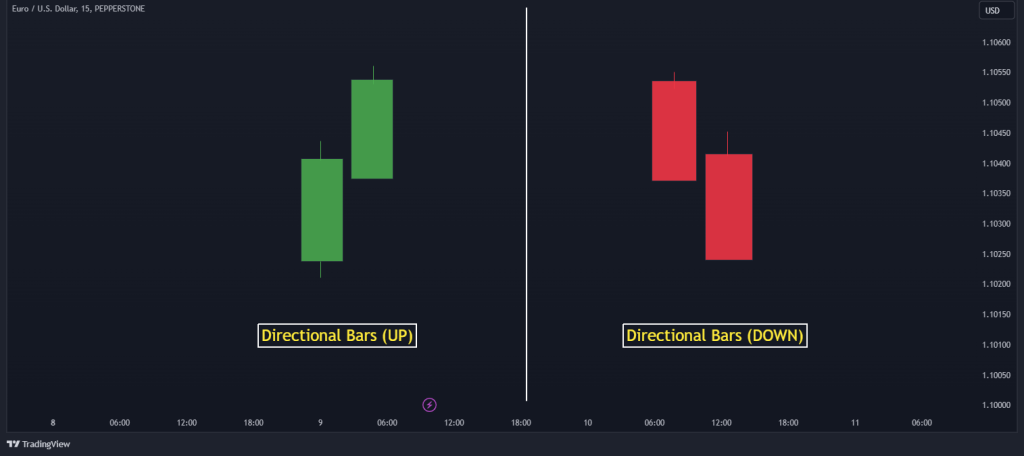
Directional Bars are also a must-mention when discussing Strat trading, as they provide crucial insights into market trends and potential shifts. A Directional Bar occurs when the current candle surpasses either the high or the low of the preceding candle, indicating a definitive move in the market direction.
Here’s a quick way to identify them: a Directional Bar Up (2U) occurs when the current bar’s high surpasses the previous bar’s high, signaling an upward trend. Conversely, a Directional Bar Down (2D) is identified when the current bar’s low goes below the low of the previous bar, indicating a downward movement in price. The image below shows how they look on the chart:
How to Decode the Structure of Strat Patterns
Perhaps, the most important element of Strat trading is the formation of chart patterns. Unlike basic and even advanced chart patterns, Strat trading leverages specific two to three-candle patterns, such as the 2-1-2, 3-1-2, and more, to predict market behavior. Understanding these patterns is key to mastering the Strat methodology.
Before using this methodology, you must learn all of those formations; however, here are some of the basic Strat candle combinations:
2-1-2 Pattern
This pattern begins with a Directional Bar (either 2U or 2D), followed by an Inside Bar (Scenario 1), and concludes with another Directional Bar. The 2-1-2 pattern is a strong indicator of a potential trend continuation or reversal.
3-1-2 Pattern
The 3-1-2 pattern comprises an Outside Bar (Scenario 3), an Inside Bar, and concludes with a Directional Bar. This pattern is significant in identifying broadening formations and potential shifts in the market trend.
1-2-2 RevStrat Reversal
The structure of the 1-2-2 Reversal pattern begins with an Inside Bar, followed by two consecutive Directional Bars (either 2U or 2D). This pattern is indicative of a strong reversal, particularly when the Directional Bars confirm a shift from the initial trend indicated by the Inside Bar.
2D-2D Continuation
This involves consecutive Directional Bars Down (2D). So, this pattern suggests a strong downward trend continuation, with each successive 2D bar reinforcing the bearish sentiment.
2U-2D Reversal
This particular Strat pattern starts with an Upward Directional Bar (2U) followed by a Downward Directional Bar (2D). This indicates a potential reversal from an uptrend to a downtrend, often signaling a shift in market sentiment.
3-2U Range Expansion Continuation
The pattern starts with an Outside Bar (Scenario 3) followed by an Upward Directional Bar (2U). This suggests a continuation of an upward trend, particularly after a period of uncertainty or consolidation indicated by the Outside Bar.
What’s the Purpose of Using the Strat Trading Technique?
Generally, the Strat trading method focuses on the relational dynamics of individual candlestick patterns, their alignment with support and resistance levels, and their integration across various time frames. The primary goal of the Strat method is to foster objective trading by minimizing emotional influences and relying on factual, market-driven data. By doing so, it seeks to cut through market noise and offers traders a clear, unbiased view of market movements.
Simply put, this technique aims to naturalize your trading decisions. When using the Strat trading strategy, you are trading with no emotions and rely solely on Start patterns. Even better, most Strat patterns can be easily identified by professional traders, which means that within time, you’ll be able to easily identify these patterns on price charts.
Important aspects of Strat trading are the identification of a variety of candle patterns, broadening formations, and time frame continuity. These concepts are central to Rob Smith’s thesis that securities often trade in such fluctuating patterns, thus providing crucial insights into potential market reversals or continuations. Based on his theory, that’s all you need to trade the markets. The charts simply provide everything needed to analyze the markets, and that’s what Strat trading is all about.
The Strat technique aims to naturalize your trading decisions by removing all emotions and relying solely on repetitive Strat chart patterns.
Strat Trading Multiple Time Frame Analysis
In Strat Trading, the concept of Multiple Time Frame Analysis is pivotal to understanding market trends and making high-probability trading decisions. This analysis of multiple timeframes methodology involves analyzing two higher timeframes in conjunction with the current timeframe to enhance the probability of successful trade setups.
According to Rob, there are three main timeframes in Strat trading, namely:
- Tides: This refers to the Monthly and Weekly Charts, representing the broader market trends. These charts help in understanding the long-term direction of the market.
- Waves: Daily Charts fall into this category. They provide a more granular view than Tides but still maintain a focus on the medium-term market trend.
- Ripples: Comprising the Hourly and Lower Time Frame Charts, Ripples are crucial for short-term trade setups and immediate market movements.
Application Example
Here’s an example of how to put this multi-timeframe analysis together to form a trading decision.
Monthly Chart: Suppose a 2-2 bullish continuation pattern emerges on the Monthly chart, signaling a bullish trend and higher highs.
Weekly Chart: On the Weekly chart, the emergence of a similar 2-2 pattern corroborates the bullish trend indicated on the Monthly chart.
Daily Chart: If a 3-1-2 bullish reversal pattern forms on the Daily chart, it further aligns with the bullish trends observed in both the Monthly and Weekly charts.
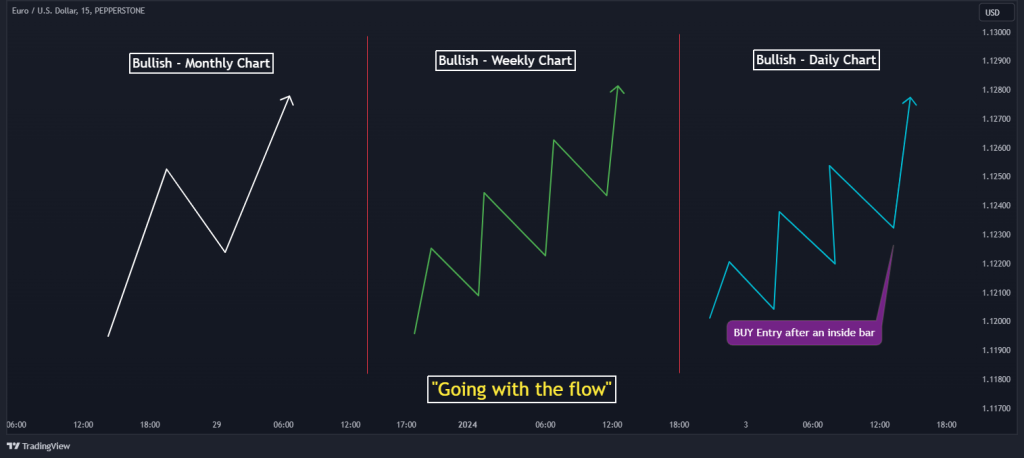
When all three timeframes show alignment in their directional trends, it’s referred to as “going with the flow.” This alignment dramatically increases the probability of a successful trading setup. For instance, in our example, a trader would ideally place a long position upon the breakout of an inside bar or the #1 candlestick on the Daily chart, considering it a high-probability trade setup.
It gets even better if other factors, such as supports, resistances, or indicators, corroborate your trade idea. This adds confluence to your system.
The Free Strat Trading Strategy PDF
If you need something you can easily refer to, you can download our free strat trading strategy PDF here:
The Free Strat Trading Strategy PDF
What are the Benefits and Limitations of Strat Trading?
Strat Trading, though powerful, isn’t without its limitations. Here’s how they compare with the advantages that this trading strategy provides:
Benefits of Strat Trading
The Strat Trading Strategy is lauded for its systematic approach, offering traders a way to navigate various markets and time frames with an objective and non-emotional trading methodology.
This strategy can help traders find trading signals by just knowing the implications of 2-3 structured candlesticks. That’s the main benefit of using it. And for that reason, it is primarily considered as an ideal strategy for intraday traders.
Other key benefits include:
Pros
- Offers structured methodology to trade the markets.
- Provides a non-emotional way to trade.
- Very simple to understand and apply.
- Ideal strategy for intraday traders.
- Can be applied across any market or time frame.
Limitations of Strat Trading
While Strat Trading offers numerous benefits, it’s also important to consider its limitations. For instance, it might be challenging for new traders due to the complexity and the investment required to access full resources. Some other flaws of Strat trading include:
Cons
- It may be overwhelming for beginners.
- Requires dedication to understand and apply effectively.
Does the Strat Trading Method Work?
So, does the Strat trading strategy work? Well, yes, for some, at least. Many who use it claim it works for them, and there’s a good reason why. The Strat trading method, with its emphasis on objective analysis and versatile application across various markets, can certainly help traders to better understand market dynamics and to properly analyze the markets. That’s why it has garnered such positive feedback for its structured approach and community support.
While the initial learning curve and cost may be high, many traders find the systematic, non-emotional approach of the Strat conducive to making informed decisions. Yet, you must keep in mind that its effectiveness, like other trading strategies, depends on the user’s understanding, discipline, and ability to adapt to market conditions.
Frequently Asked Questions About Strat Trading
Here are some frequently asked questions about the Strat Trading Method:
What is the Strat method of trading?
The Strat method is a technical analysis strategy focusing on candlestick patterns and price action, emphasizing the relationship between individual candles, support, and resistance levels, and multi-timeframe analysis.
What are Strat options?
Strat options are not a specific product but refer to the application of The Strat methodology in options trading, utilizing its principles to inform options trading decisions.
How do you read Strat candles?
Reading Strat candles involves analyzing candlestick patterns, especially inside and outside bars, and understanding their implications in the context of overall market trends and time frame continuity.
How can I learn the Strat trading strategy?
Learning The Strat can be initiated through various online courses and communities. These resources offer structured modules and community support to aid in understanding and applying the strategy effectively.
Risk Disclosure: The information provided in this article is not intended to give financial advice, recommend investments, guarantee profits, or shield you from losses. Our content is only for informational purposes and to help you understand the risks and complexity of these markets by providing objective analysis. Before trading, carefully consider your experience, financial goals, and risk tolerance. Trading involves significant potential for financial loss and isn't suitable for everyone.