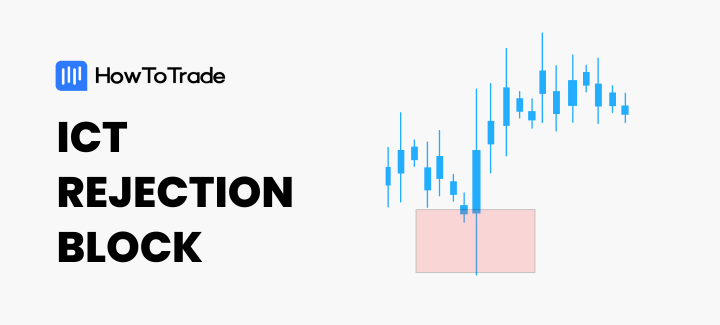
- Rejection blocks are formed when the price sharply moves to a level but is quickly rejected, leaving a prominent wick or shadow on the candlestick.
- They act as dynamic zones of support or resistance. When the price revisits them, it often reacts at that level again, making these blocks useful for predicting potential reversals or continuations in price movement.
- When trading rejection blocks, we highly recommened that you wait to see a confirmation of your bias before you enter the trade.
An ICT rejection block is a concept that serves as a supply or demand zone for future price movement. It appears at the wicks of the candles at a swing high or low before the price reverses to shift the market structure. It’s often the last opportunity for the price to reverse. Should the price fail to reverse in this area, you may have a new trend.
In this blog post, we’ll show you:
- What rejection blocks are and their types
- How to identify rejection blocks on your chart
- How to trade rejection blocks, and
- Extra tips on how to trade them the right way.
 Table of Contents
- What are Rejection Blocks?
- What are the Types of Rejection Blocks?
- How Do You Identify A Rejection Block?
- How To Trade Rejection Blocks
- What are the Advantages and Disadvantages of Trading Rejection Blocks
- How are ICT Rejection Blocks Different from Order Blocks?
- Final Thoughts on Trading Rejection Blocks
What are ICT Rejection Blocks?
Rejection blocks are a concept in ICT (Inner Circle Trader) trading that represent long wicks at the top or bottom of a swing, preferably sweeping liquidity with those wicks before a reversal to shift market structure.
Rejection Blocks occur at areas on the chart where the price strongly rejects a specific level, indicating a temporary shift in market sentiment. These blocks act as dynamic zones of support or resistance, where price movement sharply reverses, often due to significant buying or selling pressure.
What are the Types of Rejection Blocks?
Depending on the direction in which the block is likely to push the price, there are two types of rejection blocks: the bullish rejection block and the bearish rejection block.
1. Bullish ICT Rejection Block
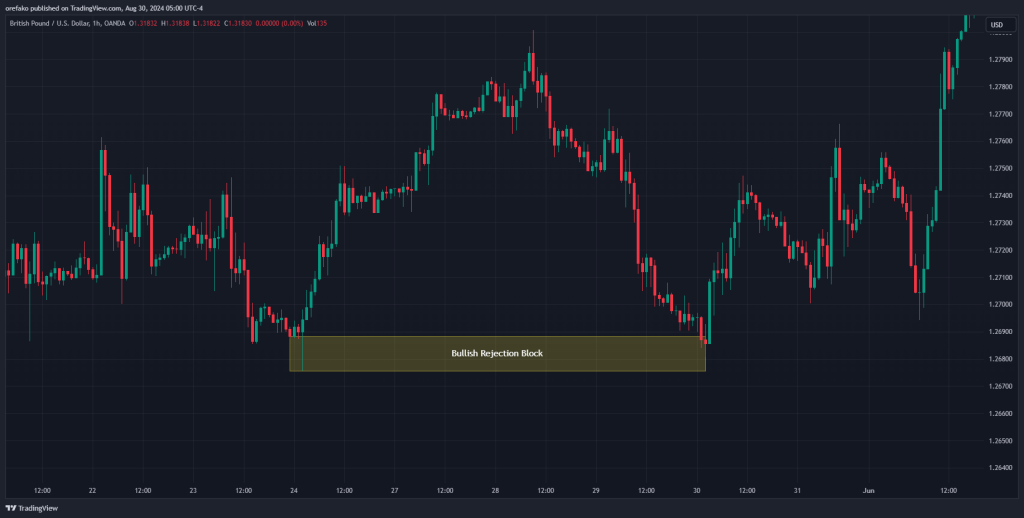
The bullish rejection block forms at the bottom of a swing low on the wicks of the lowest candlesticks before a market structure shift. Usually, the price returns to this level and then reverses to the upside like it would at a bullish order block. The bullish rejection block is drawn from the lowest wick’s tip to the lowest candlestick’s open or close.
2. Bearish ICT Rejection Block
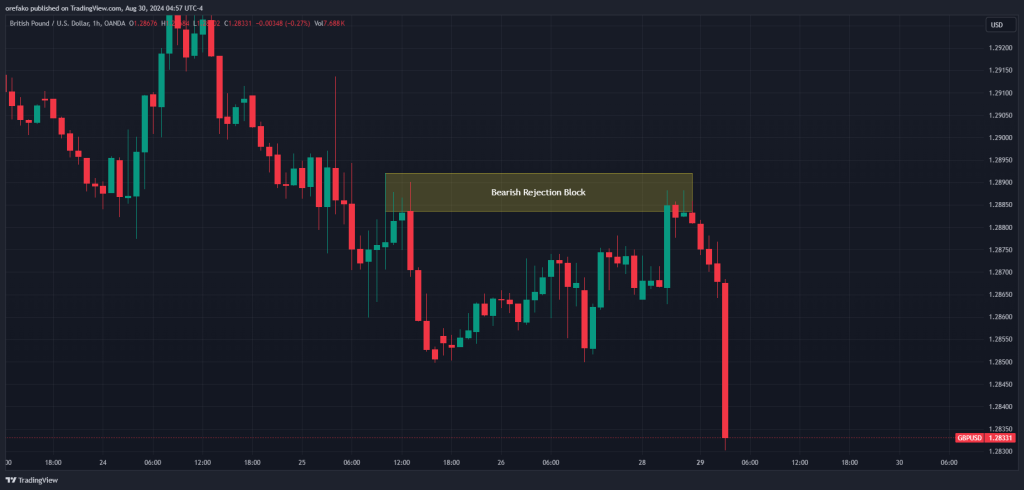
A bearish rejection block forms at the top of a swing high on the wicks of the highest candlesticks before a market structure shift. On returning to this block, the price tends to reverse to the downside like it would at a bearish order block. The bearish rejection block is drawn from the highest wick’s tip to the highest candlestick’s open or close.
How Do You Identify An ICT Rejection Block?
Here’s a step-by-step process to identify the rejection block on your chart:
1. Locate the areas where rejection blocks are likely to form.
Rejection blocks will likely form at three areas: swing highs or lows, supply or demand levels, and after the sweep of liquidity.
When you see candlesticks at the extreme swing of the price having long wicks before reversing, it suggests that the price tried to go further, but the opposing side of the move was strong enough to reject the movement and turn the trend around. That’s how rejection blocks form at swing points.
For supply or demand zones, you’ll often see the wick just going past a supply or demand before the reversal to shift the market structure. Finally, when a liquidity level has been swept emphatically by long wicks before a reversal, those wicks are potential rejection blocks.
2. Observe the most extreme candle(s) open/close and its wick(s).
At that swing point, pick out the candle(s) that have its close price at the farthest point. And in a swing low, you’re looking at the bullish or bearish candle(s) whose open or close, respectively, is the lowest.
3. Mark out the wicks
Next, you mark out the wick(s) from the open/close of the most extreme candlestick to the tip. This width is your rejection block. And if you have multiple candles at the extreme end, you mark out the wicks starting from the farthest body’s open or close to the tip of the longest wick.
PRO TIP: Look for bullish rejection blocks in bullish trends and look for bearish rejection bocks in bearish trends.
How To Trade ICT Rejection Blocks
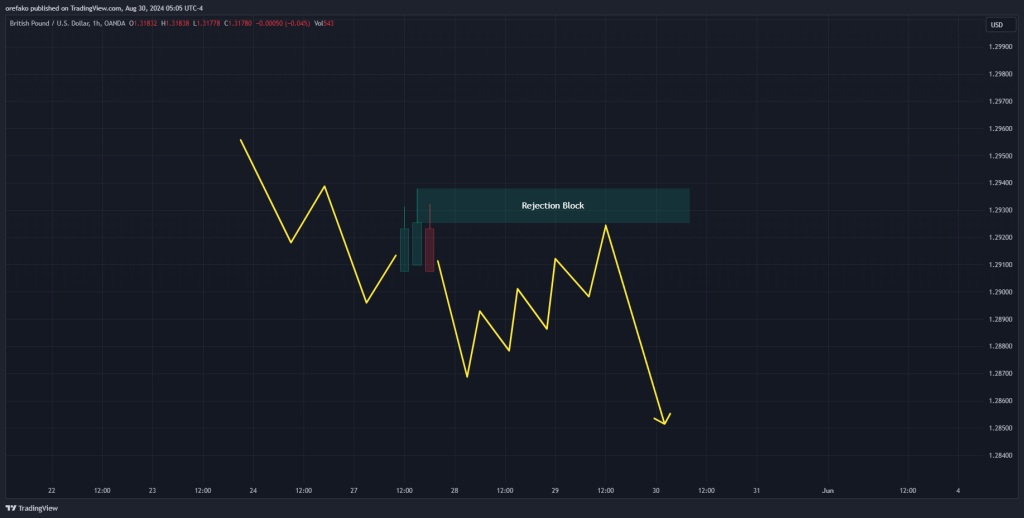
Many trading strategies make use of the ICT Rejection Block. Let’s show a simple rejection block trading strategy with a GBPUSD chart example on the 1-hour chart.
Trade Entry and Exit
The first thing to do is identify your rejection block, preferably one that has cleared liquidity. Once you have that, you can wait for the price to return to it and see how things react.
Aggressive traders will place their trade entry just at the rejection block, which makes sense if the larger market context is right. However, we recommend that you wait for some form of confirmation before you place your trade at a rejection block. This confirmation could be in the form of a change of character or market structure shift on a lower timeframe, a clear displacement in the right direction that leaves an FVG behind, or even candlestick patterns like the engulfing bar.
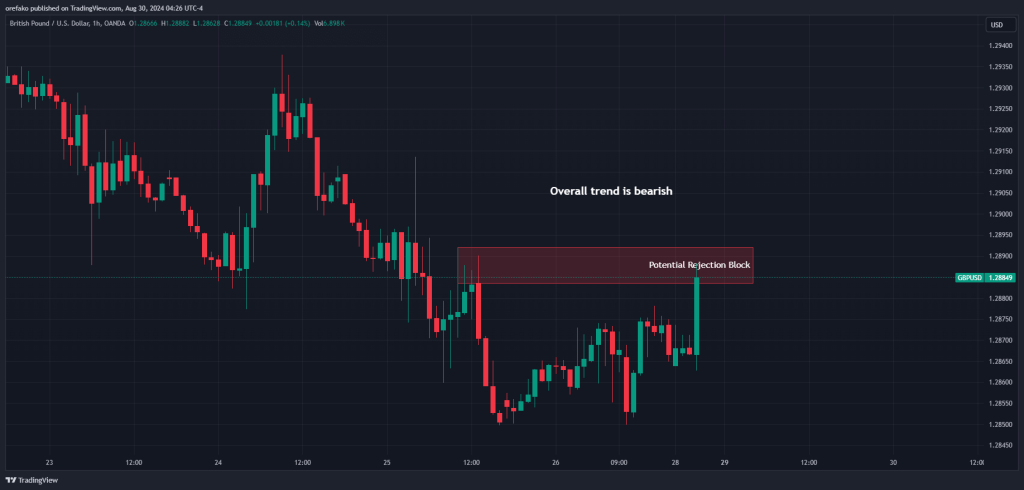
In our GBPUSD example above, the price retraced to our rejection block. The overall trend is bearish on the hourly chart, and we’re looking to continue the trend from the rejection block. But we don’t enter immediately the price taps the rejection block. Rather, we go to the 5-minute timeframe to see if something suggests a reversal.
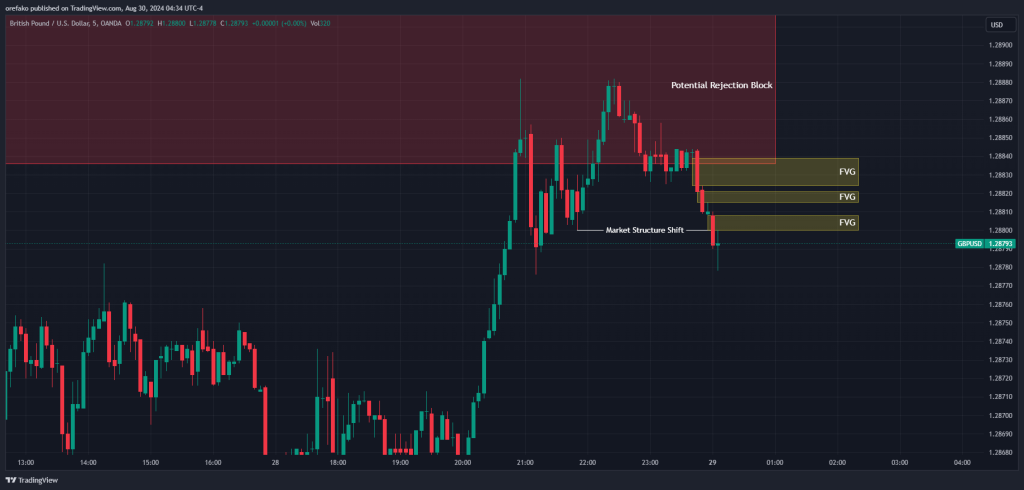
There, we find a market structure shift and a displacement, leaving two Fair Value Gaps behind. This, for us, is a clear sign that the price is gearing up for a reversal.
We then place our limit entry just at the middle FVG. Your choice of FVG is up to you. However, know that placing it at the farthest FVG could get you a good risk to reward but you’ll miss more trades. Also, placing it at the closest FVG could ensure you’re in trades more often at the expense of wider stop losses.
Another way to enter is to place a market order to enter the trade immediately after the displacement candle closes. The first method will guarantee a higher risk to reward but may cause you to miss out on some trades should the price not retrace to your level. The second entry method ensures you are always in a trade when this setup forms, but not necessarily at the best risk-to-reward ratio.
You can know your optimal entry by backtesting extensively and seeing what worked best.
The reason we avoid entering immediately on a rejection block is because the only way to know a rejection block is reliable is to see it confirm itself. In other words, we prefer to see the price show signs of reversal before jumping in. Otherwise, we would be trading every wick at every swing point, which is a sure way to not be profitable.
Risk Management
Ideally, your stop loss should be below the rejection block in a bullish scenario and above the rejection block in a bearish scenario.
This stop-loss placement is based on the idea that if the rejection block gets violated, chances are that the price is changing direction. Remember that the rejection block is usually the last line of defense in a market structure. So, it just makes sense to place your stop loss at the other side of your entry.
However, you can make a call to place it at the top of the new swing, just like we did in our GBPUSD example.
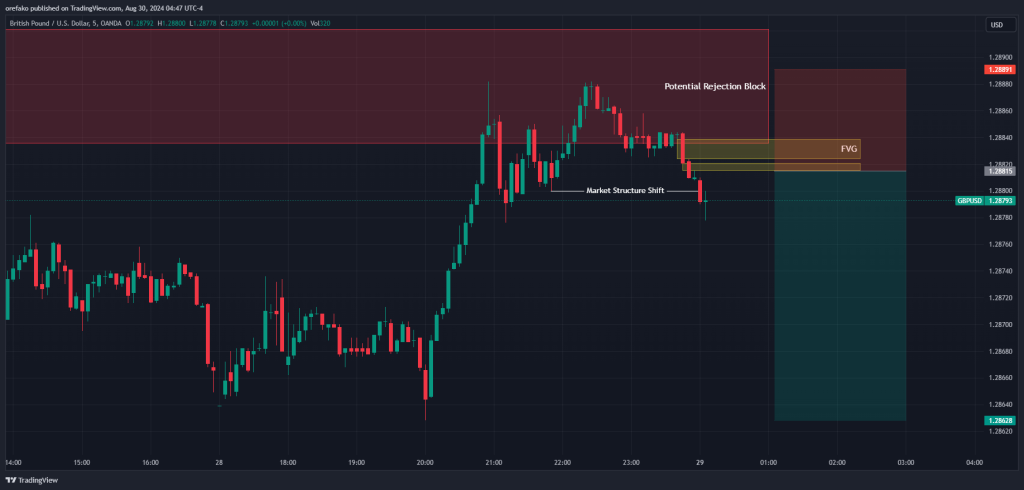
Your profit target, however, can be more flexible, depending on your trading strategy or style. For instance, you can take profit at the next significant supply or demand, high or low, or even on a higher time frame level. You could even use an opposing rejection blocks as your exit points. There are so many ways to go about this. But to keep things simple, just go for a 1:1.5 of 1:2 risk-to-reward ratio. You can also backtest this ratio and journal your trades to know where exactly is the best to place your profit target.
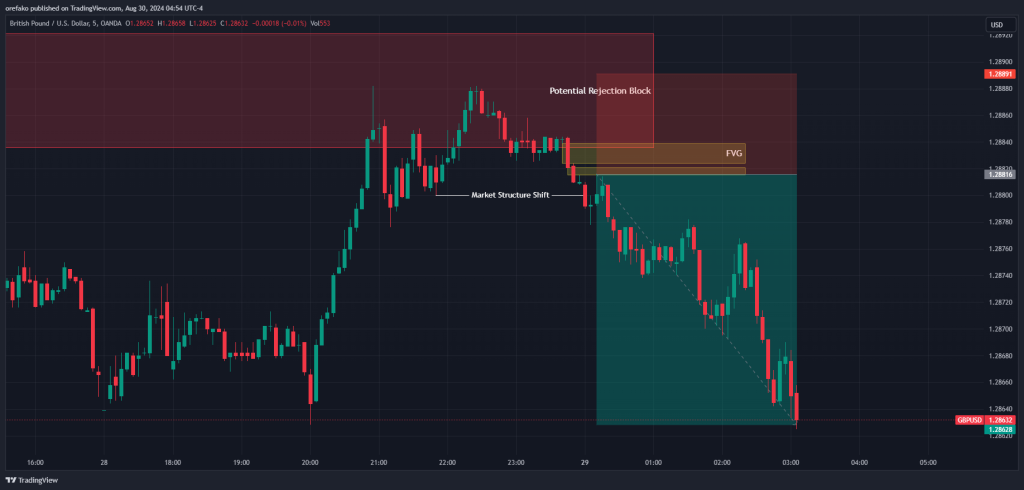
The image above is what the trade looks like.
What are the Advantages and Disadvantages of Trading Rejection Blocks?
One of the first advantages of trading rejection blocks is that you would typically get higher risk-to-reward ratios. The reason is that rejection blocks are formed with the wicks of candlestick at the extreme ends. This means that they are the last line of defense for any trend continuation.
If a bullish rejection block fails, the trend will be bearish. And the same is the case for a bearish rejection block. Chances are that the trend will go bullish if the block fails. So, because they are at the extreme, your stop levels don’t have to be too far away, and you can get higher returns for your risk if the price action reverses from the block.
On the flip side, a rejection block can sometimes be a last-ditch effort to convince yourself that a trend is not changing. For instance, traders who have seen other forms of demand/supply zones before the rejection block fail may consider the rejection block the final level before the price confirms its reversal. They might even have taken losses on the levels before the block, but they hold on stubbornly to the idea that the rejection block will do what many other supply/demand levels have failed to do.
That’s why we always recommend that if the price is headed for a rejection block with aggressiveness, wait for a reversal confirmation before you get into the trade.
How are ICT Rejection Blocks Different from Order Blocks?
Both order blocks and rejection blocks represent zones where institutional traders place significant orders, influencing price movements. In other words, both are demand and supply zones that are likely to cause the price to change direction.
One way they differ from one another, though, is in their formation. An order block is the last bearish candle before a significant bullish move (bullish OB) or the last bullish candle before a strong bearish move (bearish OB). More conservative traders use the last group of bullish candles before a significant bearish move or the last group of bearish candles before a significant bullish move. ICT rejection blocks, on the other hand, are the wicks around swing points. They’re the last potential point of reversal for the price.
Another major difference is that you’ll often get greater risk-to-reward ratios if you’re trading from rejection blocks than if you’re trading from order blocks. On the downside, however, rejection wicks leave you with tiny stop-losses, giving your trades less room to breathe. Additionally, if the price reaches the rejection blocks aggressively, there is a good chance that the zone is about to fail.
Final Thoughts on Trading Rejection Blocks
Having described what rejection blocks are, here are some extra tips on how to trade them:
1. Ignoring Market Context
Relying solely on rejection blocks without considering the broader market context can lead to poor trades. If, for instance, you see a rejection block that suggests that you trade against the prevailing trend, it’s likely less reliable. That’s why you should always check the higher time frame trend, market structure, and key levels like support, resistance, or liquidity pools to confirm the validity of the rejection block.
2. Overtrading Rejection Blocks
Many traders will make the mistake of taking every visible rejection block, assuming all will result in profitable trades. First off, no strategy will always be profitable. Secondly, rejection blocks can be tricky to trade, especially for novice traders. So, we recommend waiting for a confirmation to form at the rejection block before you trade it. This way, the block already confirms itself, and you just get to ride the reversal.
3. Confusing High Impact News wicks for Rejection blocks
When high-impact news candlesticks form, you’ll often see them with long wicks. A novice trader would call them rejection blocks, which is not necessarily true. They sometimes can be, but only very rarely. Don’t forget that high-impact news candlesticks are only a result of rapid market volatility after the news release. It’s just trades reacting impulsively to the news and nothing more.
4. Not Considering the Time of Day
Rejection blocks formed during low-volume times (e.g., late Asian session) are often less reliable than those formed during active trading periods (e.g., New York or London sessions). Don’t forget that rejection blocks form when the bulls try to continue a rally, but the bears sweep in to reject the movement and turn the trend around, and vice versa. For many forex pairs, this tussle is only possible during active trading sessions. And so any that has formed out of the active trading sessions is likely to be false and unreliable.
Risk Disclosure: The information provided in this article is not intended to give financial advice, recommend investments, guarantee profits, or shield you from losses. Our content is only for informational purposes and to help you understand the risks and complexity of these markets by providing objective analysis. Before trading, carefully consider your experience, financial goals, and risk tolerance. Trading involves significant potential for financial loss and isn't suitable for everyone.


