


- The Gold-Silver Ratio is a key financial term that compares the value of gold to silver and is used to determine how many ounces of silver are needed to purchase one ounce of gold.
- The Gold-Silver Ratio has a long history, with its fluctuations over centuries reflecting changes in global economies, government policies, and market dynamics.
- A high ratio favors gold, suggesting economic uncertainty, while a low ratio boosts silver during growth.
- Traders utilize this ratio to decide when to buy or sell; a high ratio typically signals a good time to buy silver, and a low ratio suggests it’s time to buy gold.
The concept of trading using the Gold-Silver Ratio is a historically rich strategy that has intrigued investors and traders for centuries. And if it has been around for this long, it must be working well.
So, in this article, we will discuss everything you need to know about one of the most fascinating ratios in financial markets.
What is the Gold-Silver Ratio?
The Gold-Silver Ratio is a financial term that measures the relative value of gold to silver. It indicates how many ounces of silver it takes to purchase one ounce of physical gold at any time. This ratio is a significant tool for traders and investors, as it helps them understand the market dynamics between these two precious metals.
Traditionally, the Gold-Silver Ratio has been used to indicate the market sentiment towards these metals. A high ratio suggests that gold is more valued than silver, often seen during economic uncertainty or when investors seek safer assets. Conversely, a lower ratio implies that silver is gaining value relative to gold, which normally occurs during periods of economic growth and industrial demand, as silver has many industrial uses.
The ratio fluctuates over time due to various factors, including supply and demand dynamics, geopolitical events, and changes in the global economy. By analyzing the Gold-Silver Ratio, traders can make informed decisions about when to buy or sell these metals, either for speculative purposes or as part of a broader investment strategy. This ratio reflects not only the market’s valuation of these metals but also an instrument for potential profit-making in the commodities market, as well as the stock and fixed-income markets.
Historical Gold to Silver Ratio
The Gold-Silver Ratio is not just a modern financial metric; it is, in fact, one of the oldest known to humanity. Historically, this ratio has been a crucial indicator in the trading and valuation of these precious metals.
In ancient times, the ratio was often set by governments for currency purposes, with the first known ratio being set by the government of the Lydian Empire in the 7th century BC. The ratio has varied significantly over the centuries. For instance, in the Roman Empire, the ratio was set at 12:1, reflecting the relative abundance of silver to gold.
Fast forward to more recent times, over the last decade, the Gold-Silver Ratio has seen considerable fluctuations, reflecting various economic and market conditions. In the early 2010s, the ratio hovered around 60:1, meaning it took 60 ounces of silver to buy one ounce of gold. This was a period marked by relative economic stability.
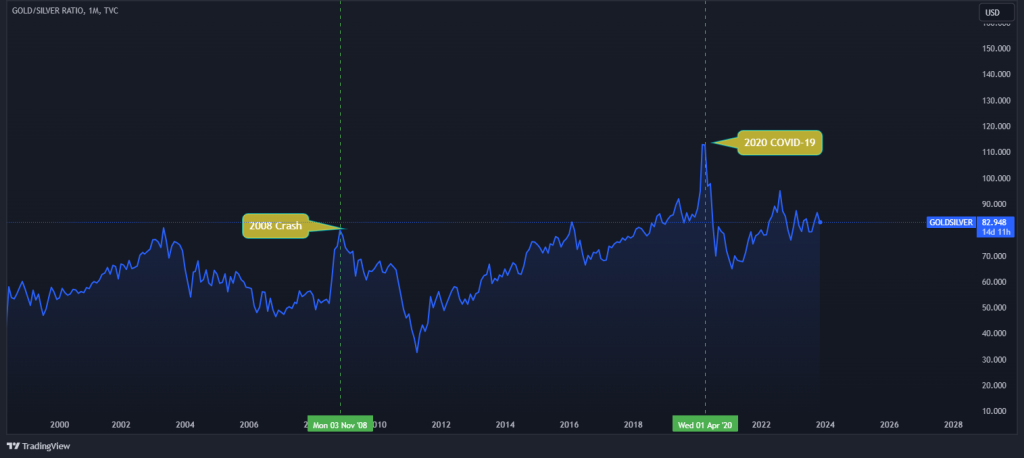
However, as you can see from the gold-silver ratio chart, the ratio has spiked during times of economic uncertainty. For example, during the financial crisis of 2008, the ratio reached highs not seen in decades. More recently, in the wake of the COVID-19 pandemic and the ensuing economic turmoil, the ratio surged, at one point exceeding 100:1 in 2020, indicating a strong preference for gold as a safe-haven asset compared to silver.
Understanding these historical trends is crucial for traders employing the Gold-Silver Ratio in their strategies. It provides context for current ratios and helps in predicting future movements. The historical perspective underscores the ratio’s sensitivity to economic conditions and its value for gauging market sentiment towards these precious metals.
When to Buy and Sell Gold to Silver Ratio?
Understanding when to buy or sell gold or silver based on the Gold-Silver Ratio is key to effectively leveraging this trading strategy. The decision to buy or sell hinges on interpreting the ratio’s current value in the context of historical trends and market conditions.
Here’s a simplified guide:
| Gold-Silver Ratio | Action for Silver | Action for Gold |
| High (e.g., >50:1) | Buy (Silver is undervalued) | Consider selling (Gold is relatively more expensive) |
| Low (e.g., <50:1) | Sell (Silver is relatively more expensive) | Buy (Gold is undervalued) |
When to Buy Silver: A high Gold-Silver Ratio, typically at or above the 50:1 mark, suggests that silver is undervalued relative to gold. This is often interpreted as a buying signal for silver. In such scenarios, silver is cheaper than gold, and investors may see it as an opportunity to purchase silver at a relatively low price. The rationale is that if the ratio decreases, the relative value of silver will increase compared to gold, potentially leading to significant gains.
When to Sell Silver/Buy Gold: Conversely, when the Gold-Silver Ratio is low, say around 40:1 or 20:1, it indicates that silver is relatively expensive or gold is undervalued. In such situations, investors might consider selling silver and buying gold. The expectation is that the ratio will normalize or increase, meaning that gold’s value could rise relative to silver, offering a favorable return on the gold investment.
The Gold-Silver Ratio can be a valuable indicator of when to buy or sell gold and silver. However, it’s crucial for traders to stay informed about the broader economic and market trends and to approach this strategy as part of a diversified investment plan.
How to Trade the Gold-Silver Ratio?
Trading gold and silver involves leveraging the historical relationship between gold and silver prices to forecast and capitalize on future market movements. Here, we’ll explore two primary methods to effectively trade the gold to silver trading strategy, focusing on the correlation between the gold-silver ratio trade and the historical high-low levels strategy.
1. Trading the Gold-Silver Correlation:
The correlation trade is based on the relative movement of gold and silver prices. Generally, when the ratio increases, it suggests that gold is becoming more expensive relative to silver and vice versa. Like forex correlation, a trader can exploit this by buying gold and short-selling silver when the ratio is low, anticipating an increase.
Conversely, when the ratio is high, indicating gold is pricier than silver, the trader would short-sell gold and buy silver, expecting the ratio to decrease. This strategy requires constant monitoring of the market and a good understanding of factors that influence gold and silver prices, such as economic indicators, geopolitical tensions, and market sentiment.
2. Trading Based on Historically High and Low Levels
This method revolves around the historical extremes of the gold-silver ratio:
Historical Highs and Lows: Pay attention to when the ratio reaches historical extremes. A high ratio (80 to 100) indicates gold is expensive relative to the silver price. Conversely, a low ratio (50 to 30) suggests gold is cheap compared to silver.
Trading at Extremes: Use these extremes as signals. For example, long silver when the ratio is historically high and gold and silver are in an uptrend. Or, short gold when the ratio is at a historical high and both metals are on a downtrend.
Risk Management: Managing your risk effectively is crucial, as the ratio has been known to exceed these historical levels. The aim is to capitalize on the potential reversals at these extreme points.
Final Word
In sum, the Gold-Silver Ratio trading strategy provides a fascinating insight into the dynamic relationship between gold and silver, two of the world’s oldest and most valued commodities. This strategy is not just a tool for speculative trading but also a window into the broader economic and geopolitical landscape.
If you are eyeing opportunities in the gold and silver markets, you should consider using SwithMarkets. This broker, renowned for its robust platform offering CFDs, stands out with its tools and resources geared towards empowering you to harness the full potential of the Gold-Silver Ratio.
Frequently Asked Questions
Here are some popular questions about the gold-to-silver trading strategy
What is a “good” gold-to-silver ratio to buy?
A “good” gold-to-silver ratio for buying depends on historical trends and market analysis. Typically, a higher ratio indicates a favorable time to buy silver. When the ratio exceeds 50, it suggests that silver is relatively undervalued compared to gold. This can be a strategic point for investors to consider purchasing silver, anticipating a future decrease in the ratio, which would increase the relative value of silver.
How can I find gold to silver ratio chart?
Gold-to-silver ratio charts can be found on various financial news websites, commodity trading platforms, and investment analysis portals. These charts provide historical data on how the ratio has fluctuated over time. Websites like Bloomberg, Reuters, and Kitco often feature up-to-date charts. Additionally, specialized investment analysis tools and apps also provide detailed charts with the option to overlay different economic indicators for a more comprehensive analysis.
What was the largest gold-to-silver ratio?
Historically, the gold-to-silver ratio has seen significant fluctuations. The largest gold-to-silver ratio was recorded in March 2020, reaching an all-time high of around 125. This unprecedented peak was primarily attributed to the economic uncertainties and market disruptions caused by the global COVID-19 pandemic, which led to a surge in gold prices while silver prices lagged.
When should I trade silver for gold?
The decision to trade silver for gold should be based on the current gold-to-silver ratio and the anticipated future movements of this ratio. When the ratio is low, indicating that gold is cheaper than silver, it could be an opportune time to trade silver for gold. Ratios below 40 have traditionally been seen as favorable for such a trade. However, it’s important to consider other market factors and personal investment strategies before making this decision.
Risk Disclosure: The information provided in this article is not intended to give financial advice, recommend investments, guarantee profits, or shield you from losses. Our content is only for informational purposes and to help you understand the risks and complexity of these markets by providing objective analysis. Before trading, carefully consider your experience, financial goals, and risk tolerance. Trading involves significant potential for financial loss and isn't suitable for everyone.


