Key Points
- NOAA predicts the strongest Atlantic hurricane season since 2010.
- US underground inventories came in at 84 Bcf, well above expectations of 77 Bcf.
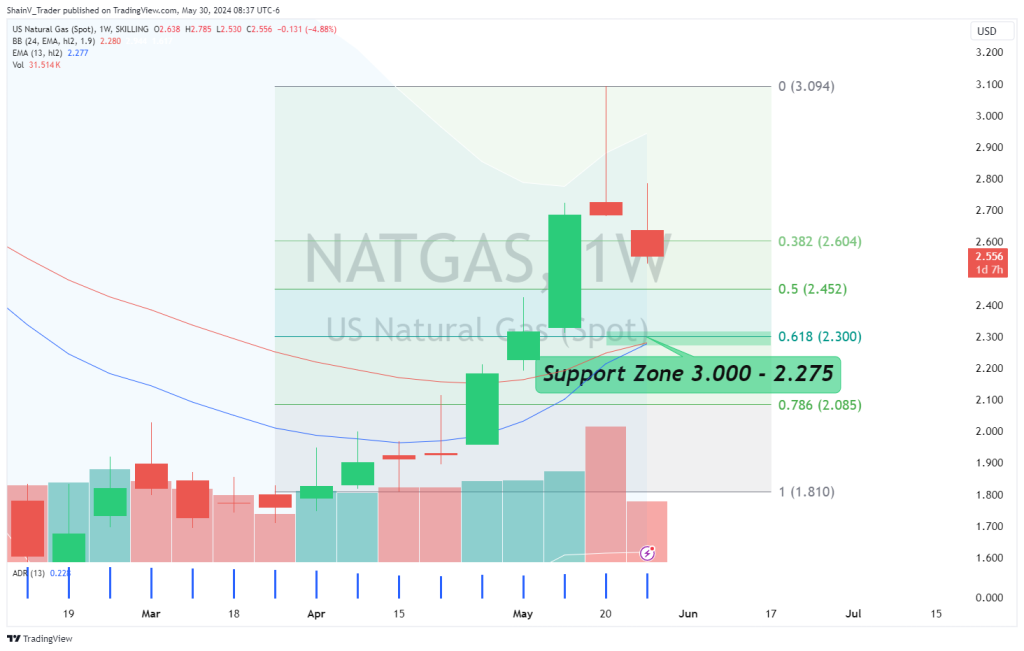
- Converging indicators have defined a key NATGAS support zone at 2.300 and 2.275.
Market Overview
Although natural gas (NG) is in spring seasonality, prices remain high compared to winter 2024. This is counterintuitive to historical norms, but those norms may be changing. Natural gas has become a staple of electrical grids worldwide and may be in the fledgling stages of an epic bull run.
So, is traditional NG seasonality dead? The answer to that question remains a mystery. Nonetheless, there is no denying that weather is key in natural gas pricing. For the coming months, hurricane season is the premier meteorological event that could drive NG prices directional.
A Strong Hurricane Season Predicted
The Gulf Coast region in the United States is a major offshore oil and gas producer. These operations are located in the Gulf of Mexico, making them extremely vulnerable to hurricane activity; the extreme weather conditions can quickly knock production offline.
Last week, the National Oceanic and Atmospheric Administration (NOAA) released its 2024 hurricane season forecast. NOAA predicts an active season with 17-25 named storms, of which 8-13 may develop into hurricanes. This is the highest number of storms ever forecast by NOAA.
NG drilling and production are limited in the Gulf of Mexico, accounting for only 2% of US-marketed natural gas. However, it is a major hub for exporting liquified natural gas (LNG). If hurricane season 2024 is severe, then the extreme weather pattern will be a bullish NG market driver.
EIA Inventories Shatter Expectations
Thursday marks release of the weekly US natural gas inventories report. Analysts estimated EIA inventories to be 77 billion cubic feet (Bcf), below last week’s 78 Bcf.
The EIA’s official report came in at 84 Bcf, well above expectations. This is a potential bearish market driver as growing supplies typically lead to falling prices.
NG Technical Overview
Last week, we examined the macro technicals for natural gas. At press time, the Weekly 38% retracement level is in the rearview mirror. The May correction is significant, as gas is down nearly 6% in the past two weeks.

For the NATGAS CFD, the Weekly 62% Fibonacci Retracement (2.300) has a chance to be robust downside support. It coincides with the Weekly Bollinger Midpoint (2.280) and the 13-week EMA (2.277). Going into June’s trade, the convergence zone between 2.300 – 2.275 will be one to watch.
Risk Disclosure: The information provided in this article is not intended to give financial advice, recommend investments, guarantee profits, or shield you from losses. Our content is only for informational purposes and to help you understand the risks and complexity of these markets by providing objective analysis. Before trading, carefully consider your experience, financial goals, and risk tolerance. Trading involves significant potential for financial loss and isn't suitable for everyone.


