


For a few hours on Thursday, the Dow Jones traded above the 40,000 level. The index broke this psychological level on the energy it gained when it finally saw a slowing inflation report for the first time since the beginning of the year.
Key Points
- The index briefly crosses the 40,000 psychological level for the first time on Thursday after the CPI data on Wednesday.
- Although this level failed to hold, it’s more of a psychological win for the US stock market, given the increased chances of a September Fed rate cut.
- The key price level for the index is 39,964.
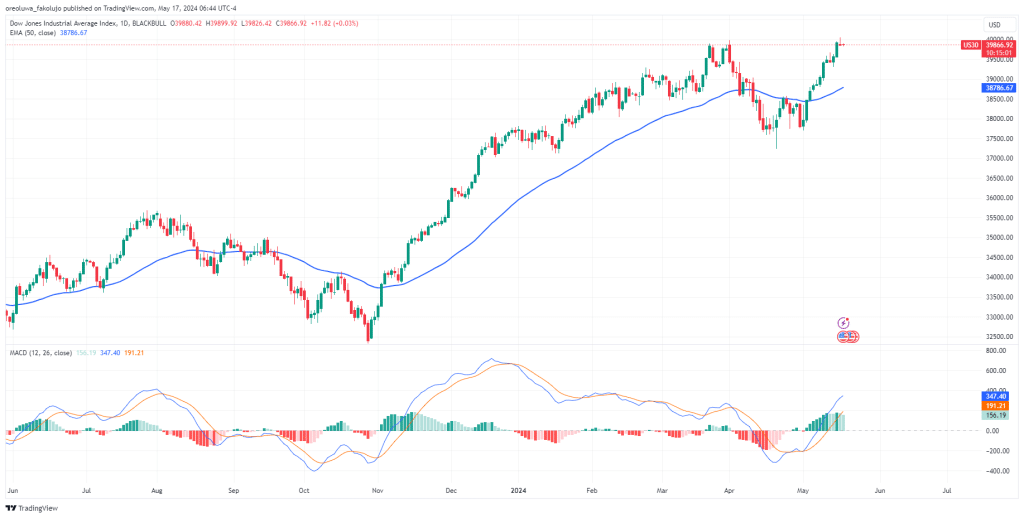
Dow Jones Daily Price Analysis – 17/05/2024
Although the index ended the day at a 0.17% loss, the bigger news on Thursday was that the price briefly passed the 40,000 psychological mark before finally ending the day lower.
Wednesday’s CPI report was the soft landing the stock market had been looking for after all of Q1’s CPI reports bore no good tidings. Core inflation had dipped to 3.4% YoY and MoM. If the economy continues to go in this direction, the Fed can finally ease the interest rate from sky-high levels.
The economy isn’t the only factor behind the Dow Jones rally. The Artificial Intelligence craze has also contributed significantly to the index, with some of the biggest AI-exposed companies being components of the DJI.
Technically, the index’s outlook is still bullish, as the 50 EMA and the MACD will have us believe. The 50 EMA sits far away from the price, while the MACD only has bullish bars.
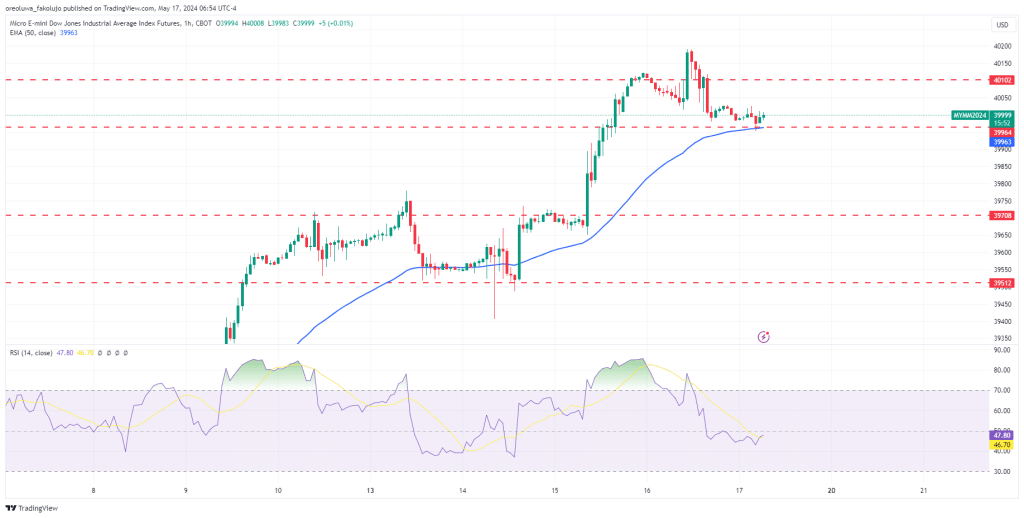
Dow Jones Intraday Technical Analysis – 17/05/2024
The daily direction of the index may depend on what the price does around the 39,964 support level on the hourly chart. Should this level hold the price, we may see another venture beyond the 40,000 psychological level and then the 40,102 resistance level. As things stand, though, the RSI is below 50, which is a bearish signal.
Below the 39,964 level, however, we have the 39,708 and 39,512 supports, where investors may expect some form of reaction.
Key Economic Data and News to be Released Today
The CFTC speculative net positions will be released today. Also, Fed officials have testimonies today. Beyond that, the economic calendar for Friday is quite light. Investors will already be preparing for the coming week.
DJI Key Pivot Point 17/05/2024
Based on the 1hr chart, the key Pivot Points for DJI are these:
| S2 | S1 | P | R1 | R2 |
| 39,849 | 39,930 | 40,060 | 40,141 | 40,271 |
Related Articles:
Risk Disclosure: The information provided in this article is not intended to give financial advice, recommend investments, guarantee profits, or shield you from losses. Our content is only for informational purposes and to help you understand the risks and complexity of these markets by providing objective analysis. Before trading, carefully consider your experience, financial goals, and risk tolerance. Trading involves significant potential for financial loss and isn't suitable for everyone.


