Trading Stocks with Trend Channels
Now that you know all about trend lines let’s take it one step further! Rather than drawing one trend line, how would you feel about drawing two, creating a trend channel with support and resistance lines?
In this lesson, we will explain the basics of trend channels and show you how to use trend channels in financial markets. Keep reading to learn how to effectively use trend channels as part of your stock trading strategy.
What Are Trend Channels?
Trend channels, also called price channels or trading channels, are a popular tool in the technical analysis used by traders and investors to determine good places to buy or sell a financial instrument.
Trend channels consist of at least two trend lines that connect the swing highs and the swing lows of a trending or a sideways moving market. So, in a way, you create a support and resistance level by using one technical indicator – that is, a trend channel.
Still, it’s important to note that trend channels don’t have to be perfectly parallel lines, but more on that later! First, let’s look at what a trend channel looks like on a price chart!
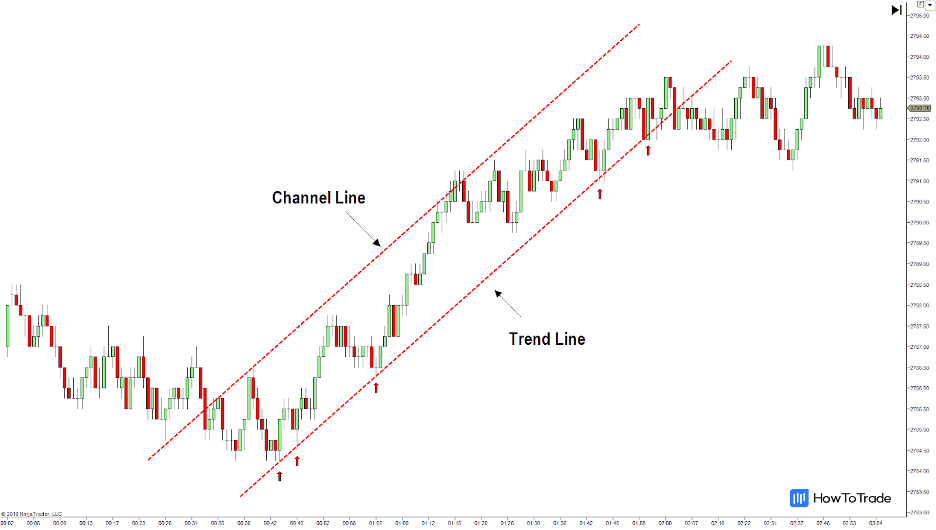
As you can see, both the upper and the lower trend lines must parallel each other, creating a price channel. In this case, as long as the stock’s price action stays inside the channel, the trend will likely continue in the same direction.
Different Types of Trend Channels
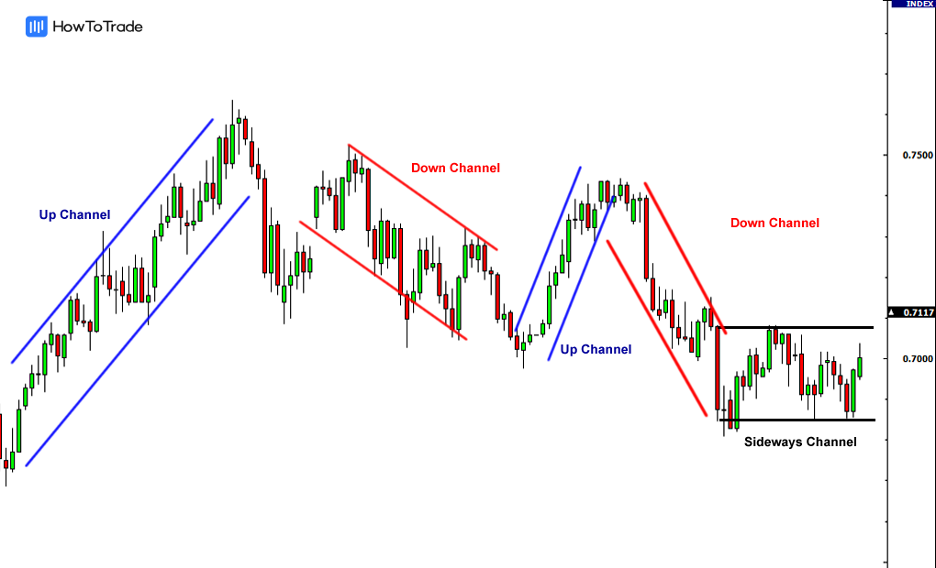
Similar to trend lines, there are three main types of trend channels.
- Ascending channel or Rising channel (higher highs and higher lows)
- Descending channel or Falling channel (lower highs and lower lows)
- Sideways or horizontal channel (ranging)
Each type of trend channel represents a different market scenario.
An ascending trend channel indicates that the market is in a bullish trend, so as long as the price stays in the channel, the uptrend is likely to continue. In the opposite version, a descending trend channel indicates that the current trend is bearish, and as long as the price stays inside the channel, the downward trend is expected to continue.
The last type of trend channel is known as the horizontal channel. It indicates that the market price is trading in a narrow range and signals that as long as the price stays inside the horizontal channel, a trader will sell the asset at the resistance level and buy it at the support level.
Drawing Trend Channels on a Stock Price Chart
Adding trend channels to a trading chart is pretty simple. After identifying a trend, you will have to draw parallel trend lines connecting at least two highs and two lows. Note that in many advanced trading platforms, you can use a trend channel tool to draw the channel automatically.
With that in mind, here’s what you need to remember about each type of trend channel.
Trend channels with a downward slope are considered bearish. The trend line is plotted above, while the trend channel line is below the price action. So, to draw a bearish channel, simply draw a straight line parallel to the downtrend line and then move that line to a position where it touches the most recent low.
Trend channels with an upwards slope are considered bullish. The trend line is plotted below the price action, while the trend channel line is positioned above the highs of the price movement. So, to draw a bullish channel, simply draw a parallel line at the same angle as an uptrend line and then move that line to a position where it touches the most recent peak.
How to Trade Stocks Using Trend Channels?
So, most importantly, you need to know how to trade stocks using trend channels. The idea of trading with this indicator is that you want to stay with the trend.
So, in an ascending trend channel, you’ll buy the asset at the support level with a stop loss below the support level, and in a descending trend channel, you will short-sell the stock at the resistance level with a stop loss above it.
That’s the idea of trend channels. You want to join the trend. For example, when prices hit the LOWER trend line, this may be used as a buying area. When prices hit the UPPER trend line, this may be used as a selling area.
As you can see, you can use trend channels in every market scenario. And whenever the price gets out of the channel, you may use it to indicate a trend reversal (better to confirm the reversal with other technical indicators).
The same applies to sideways channels. You buy the asset at the support level and sell at the resistance level, expecting the market to stay in the range. However, once the price breaks one of the support and resistance levels, you switch your strategy and enter a position in the direction of the price break.
Wrapping Up
To summarize, trend channels can be used as dynamic support and resistance levels while utilizing a trend trading strategy. As one of the biggest challenges of trading is knowing how and when to join a trend, it is the ideal method to find support and resistance levels during an ongoing trend.
And that’s why these perfectly parallel trend lines are so effective – they allow you to try to enter an existing trend with a tight stop loss, meaning the perfect risk-reward ratio.
So, no matter what type of trader you are and what trading style you prefer, trend channels are always a good idea! That said, we suggest you always confirm a trend channel by finding at least two highs and lows and using other technical indicators to determine the strength or weakness of the trend.
Moreover, we also suggest you take a look at some relevant trend channels chart price patterns including the ascending triangle pattern, descending triangle pattern, Wyckoff chart pattern, and the bullish rectangle pattern.


Up To $5,000 Credit!
- Trade 1,000’s of global markets.
- 0% deposit and withdrawal fees.
- Rapid funding turn-around times.
- Trade on MetaTrader 4 and 5.