How to Use Moving Averages (MA) in Stock Trading?
Moving averages are a key part of technical analysis and are used by traders and investors to get trading signals from charts. When used correctly, moving averages are extremely reliable and helpful indicators and can be included in numerous trading strategies and chart patterns.
So, in this lesson, we will learn more about this super popular technical analysis indicator, Moving Averages. Let’s get to it!
First, What Are Moving Averages (MA)?
Moving Averages (MA) are a technical indicator used to determine the average price of a stock (or any other tradable asset) over a set period of time. On the price chart, the moving average is displayed as a line that smoothes out stock price data. Because the price action is all smoothed out, many stock traders believe that it is a good indication of the trend direction.
A moving average is considered a lagging indicator, and it looks like this.
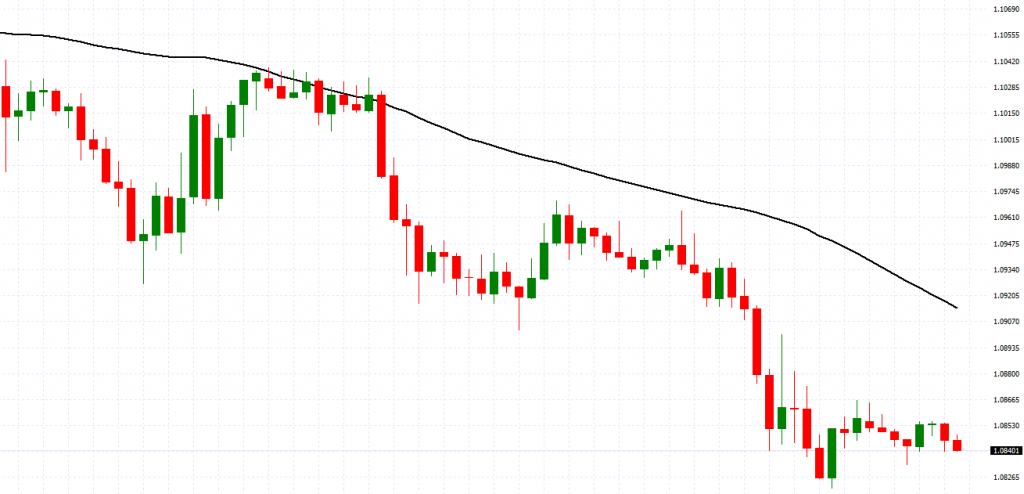
As you can see in the example above, the MA is above the stock’s market price. In such a case when the price is below the MA, the bearish trend is expected to continue. On the other hand, when the price is above the MA, a bullish trend is likely to continue.
Why Do Stock Traders Use Moving Averages?
Moving averages stocks are mega-popular amongst traders. In every forum or technical analysis prediction, you can notice that traders always talk about moving averages and MA crossings. Why? Simply because trends don’t move in straight lines in any market.
Instead, prices zig-zag and moving averages are a fantastic tool that helps traders smooth out all these random price movements. It has the power to clear out market noise and therefore make it easier for traders to identify trends, determine the trend direction and determine support and resistance levels.
In essence, moving averages are lagging or trend-following indicators. Or in other words, the MA indicator calculates the number of prices within the specified period, divided by the number of total periods (minutes, hours, days, etc.). The moving average, then, provides a visual presentation of a trend’s slope and may help traders find indications for the trend’s strength or weakness.
Calculating Moving Averages
Now, if you want to calculate an MA, you’ll need a certain amount of recent price data, depending on the length of the moving average you choose. For instance, a seven-day MA will require seven days of data. Fourteen-day MA will require fourteen days of data. Thirty-day MA will require thirty days of data. And so on. You get the point!
The shorter the length of the MA, the fewer data points are included in the moving average calculation, and therefore, the moving average price stays closer to the current price. However, the longer the length of the MA, the more data points are included in the moving average calculation, which means the less any single price can affect the overall average.
As a general guideline, the longer the period for the moving average, the greater the reliability of the MA indicator. That said, many technical traders use short and long time frame MAs to find moving average crossovers and get a signal that the existing trend is about to change soon.
Types of Moving Averages
There are two types of moving averages used by stock traders.
- Simple Moving Averages (SMA)
- Exponential Moving Averages (EMA)
Let’s explore both of them in more detail below, shall we?
Simple Moving Averages (SMA)
The first (and most popular) type of moving average we will cover is a simple moving average (SMA). You calculate it (or, more accurately, your trading platform calculates it for you) by simply taking a series of prices over your chosen period, adding these together, and then dividing the result by the total number of data points used in the calculation.
For example, let’s calculate the SMA for a seven-day period. All we need is to take the closing prices of the last seven days and divide the result by seven. Now, let’s say that the previous seven data points of the share were: 100, 102, 103, 100, 105, 109, and 105.
The moving average would add these figures together and divide by seven, resulting in an average of 103.4. Pretty straightforward, right? This basically means that the 103.4 price level acts as a support or resistance level.
Understanding how the MA indicator works means you can adjust, tweak it and eventually create different strategies as the market environment changes. It is also a great tool to confirm many chart patterns and integrate them into various trading strategies, including order blocks, scalping, day trading, etc.Obviously, most charting packages will do these calculations for you anyway, and you are not required to do it independently. However, if you need help, you can visit our next lesson on how to add technical indicators to MetaTrader 4.
Simple Moving Averages on a Stock chart
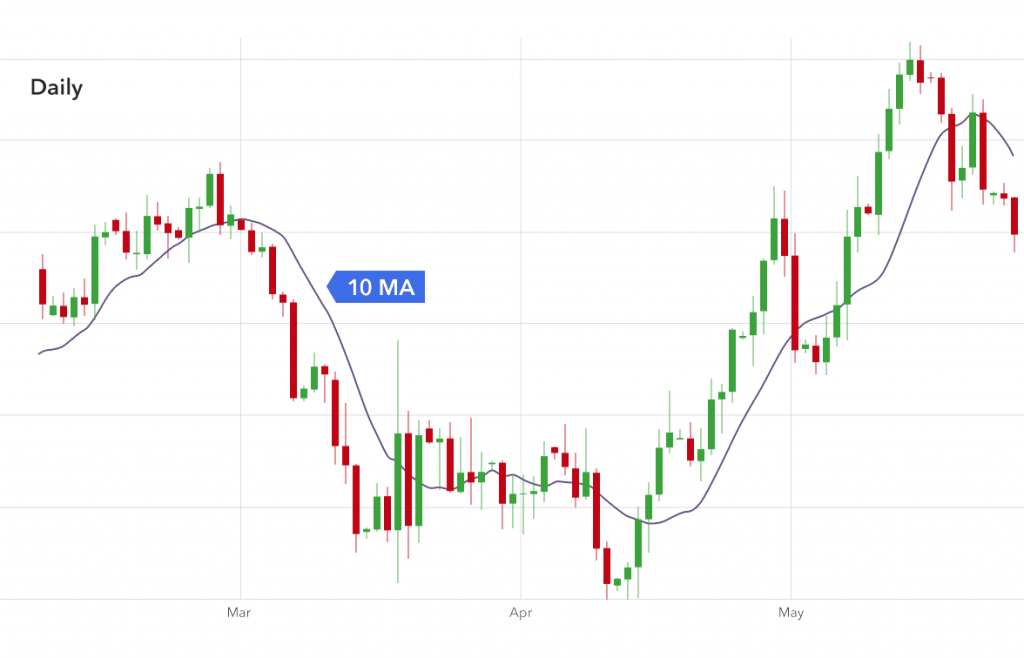
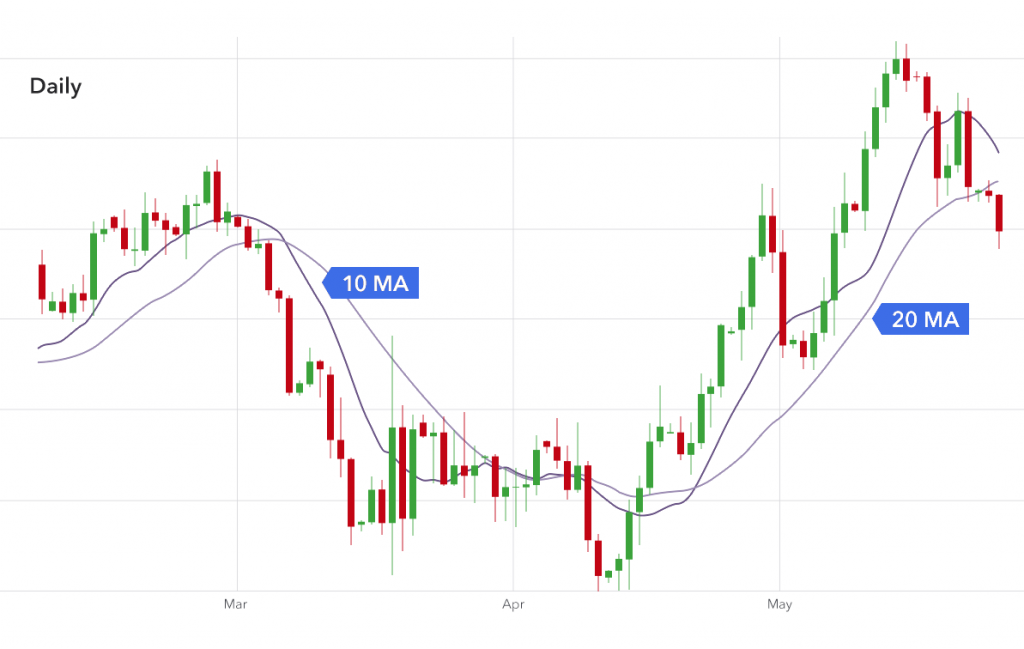
Now, let’s take a look at different examples of Simple Moving Averages (SMA) and compare how they smooth out the price action on a stock chart. And to help you visualize it better, we will plot three different SMA’s, a 10-period (short-term), a 20-period (medium-term), and a 50-period (long-term) simple moving average.
10-day period moving average
20-day period moving average
50-day period moving average
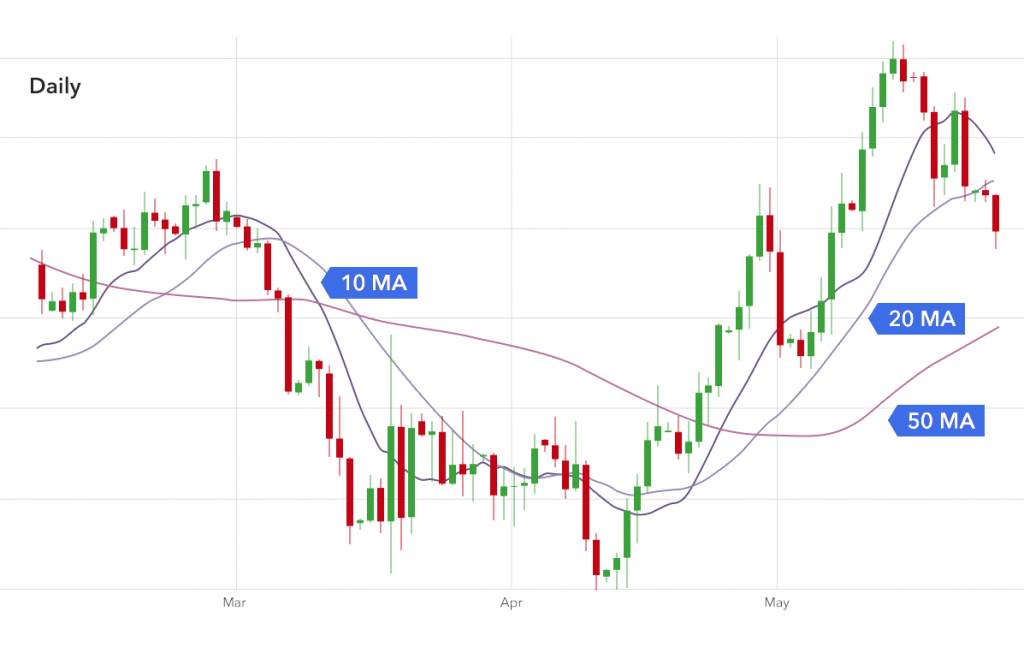
Now, out of the 10-period, 20-period, and 50-period moving averages, we can clearly see that the 50-moving average is the slowest while the 10 MA is the fastest. It is also clear that the longer the simple moving average period is, the more it lags behind the price. At the same time, the longer period you use for the simple moving average, the slower it takes to react to the price movement.
Exponential Moving Averages (EMA)
Moving on to the second type of moving averages, let’s dig deeper into exponential moving averages (EMA). Like a simple moving average (SMA), an exponential moving average (EMA) tracks the price of a share over time. However, the difference between these two is that EMA gives more importance to recent price information, and the closing price of the 1st candle will have a very (read: VERY) small effect. As a result, this makes the EMAs much more responsive to price changes of the shares.
Exponential Moving Averages (EMA) vs. Simple Moving Averages (SMA)
A picture speaks a thousand words so let’s take a look at a simple moving average (SMA) and exponential moving average (EMA) side by side on a price chart.
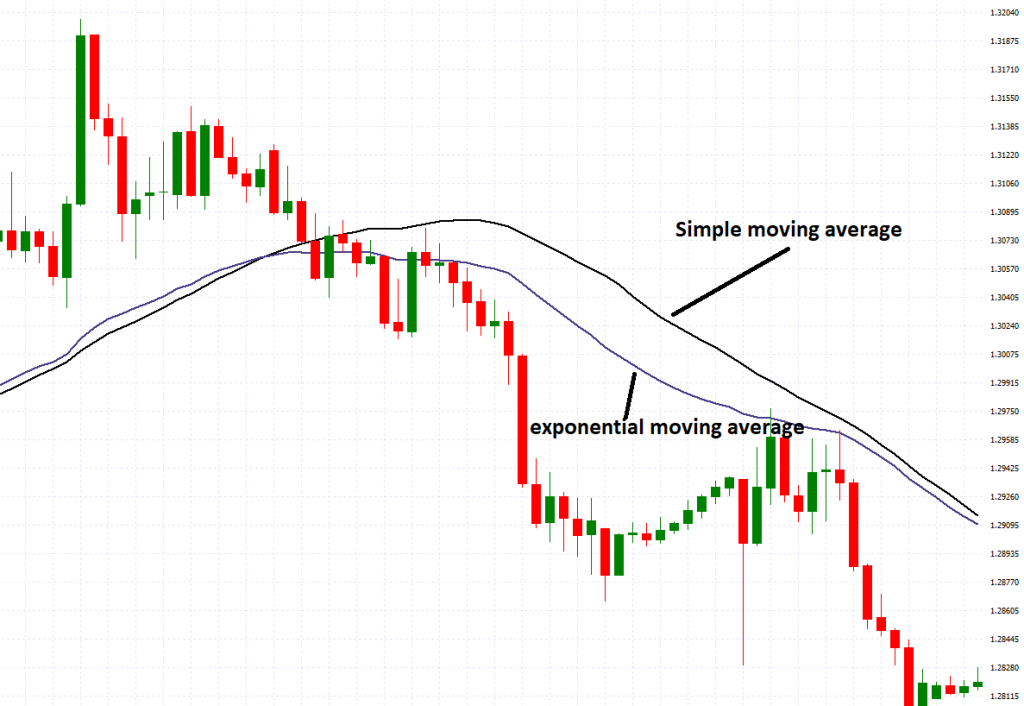
See how the blue line of the exponential moving average appears to be closer to the actual price than the black line of the simple moving average? That’s because it represents the current price action with more accuracy.
And when you are trading, you want to know what is happening NOW, not last week or month. This is why the EMA is much more accurate than the SMA.
Is SMA or EMA Better for Trading Stocks?
Truth be told, it’s all about your personal preference and your trading style. Both have their strengths and can be applied in different situations. And there’s certainly no harm in plotting both on the chart and seeing how they compare.
That said, it could be generally agreed that EMA gives more weight to recent prices, and therefore, it is most useful as a short-term trading indicator. On the other hand, SMA is mostly used by long-term investors due to its slowness. Additionally, many traders also use the Moving Average Convergence Divergence, a momentum technical analysis indicator that shows the relationship between two moving averages and helps traders understand the strength or weakness of a trend.
The Bottom Line
To sum up, moving averages are a great tool for analyzing market trends and finding trading opportunities in financial markets. Whether you are a long or short-term trader, you’ll be able to get plenty of trading signals by using SMAs, and EMAs. Further, in some cases, you need another tool to confirm a chart pattern, combine MA with other technical indicators, or get an extra trading signal to ensure you are making the right trading decision. Moving averages are ideal for that purpose.
If you are ready to use MA indicators, the next step is learning how to add them to your trading platform. So, let’s move on to the next lesson on how to set up trading indicators on MT4 and explore this effective technical analysis indicator.


Up To $5,000 Credit!
- Trade 1,000’s of global markets.
- 0% deposit and withdrawal fees.
- Rapid funding turn-around times.
- Trade on MetaTrader 4 and 5.