How to Use Trend Lines in Stock Trading?
Trend lines. Another handy and simple-to-use tool for technical analysis. Knowing how to use trend lines in the stock market can make a huge difference in your success as a trader.
Simply put, instead of looking at the fundamentals, technical traders prefer to search for trends as part of their trading strategy. They believe that a trend is where the gold is… and they’re not completely wrong!
But let’s not get ahead of ourselves. Firstly, let’s discuss what trend lines are and how to use trend lines to predict future price movements of stock prices.
What Are Stock Trend Lines?
Trend lines can be defined as straight lines that connect two, three, or more price points on a stock chart and extend into the future to act as lines of support or resistance. Technically, trend lines connect significant lows in an uptrend and significant highs in a downtrend, creating dynamic support and resistance levels.
We say dynamic because as time changes, so does the support or resistance price. For instance, if there is an uptrend, the level of the support trend line will increase as time goes on. In a downtrend, the level of resistance decreases as time goes on.
Typically, technical analysts use trend lines to determine the end of the trend or search for entry levels to join the existing trend. Moreover, drawing trend lines on multiple time frames can help traders spot the overall market sentiment, small trends, and price corrections.
How to Draw an Uptrend Trend Line in the Stock Market?
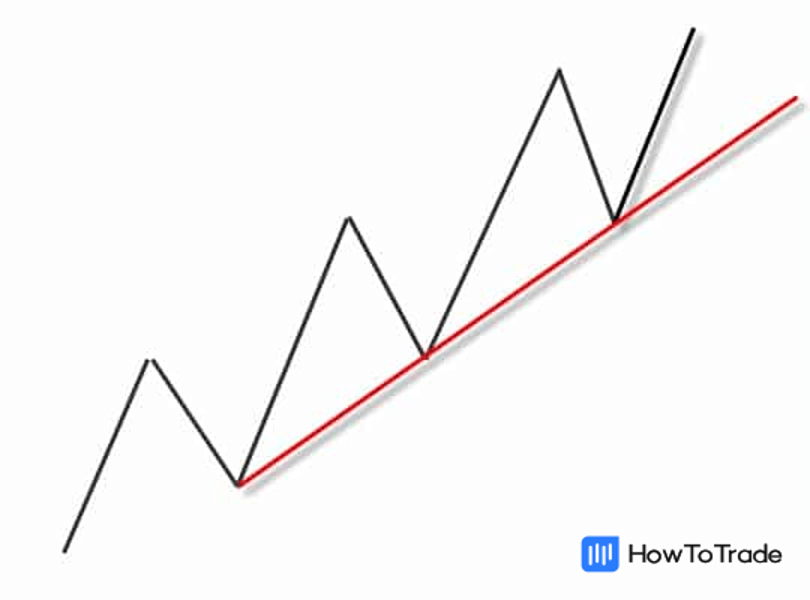
The first thing you need to know is how to draw a trend line. For example, when prices rise, the trend line is made of a straight ascending line connecting the lows, creating an uptrend trend line. In this situation, uptrend lines act as a support level, offering traders an entry-level to join the trend or exit a position.
An uptrend trend line is an upwards straight line with a positive slope formed by connecting two, three, or more low points. The second low point must be higher than the first low point and lower than the third point for the line to have a positive slope. Also, note that a minimum of three points must be connected to draw a valid trend line.
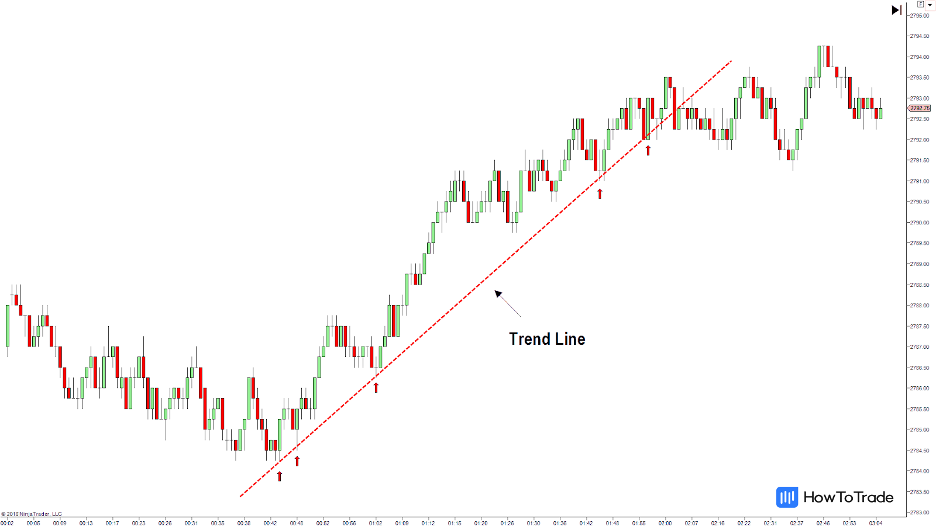
Now, let’s see it on an actual stock chart.
How to Draw a Downtrend Trend Line in the Stock Market?
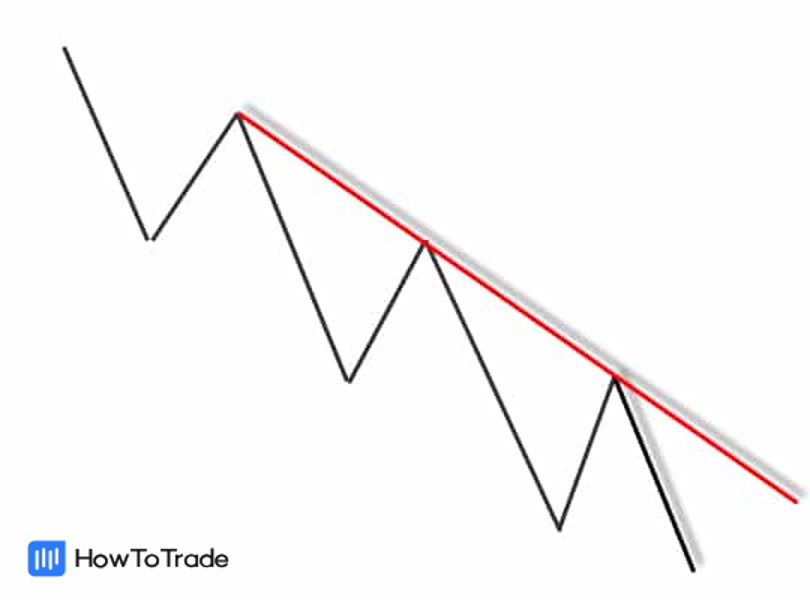
A downtrend line is a downwards line with a negative price movement or price slope and is formed by connecting two, three, or more high points. The second high must be lower than the first high for the line to have a negative slope.
As you can see, downtrend lines act as a resistance level and signal that net supply is higher than net demand in the market.
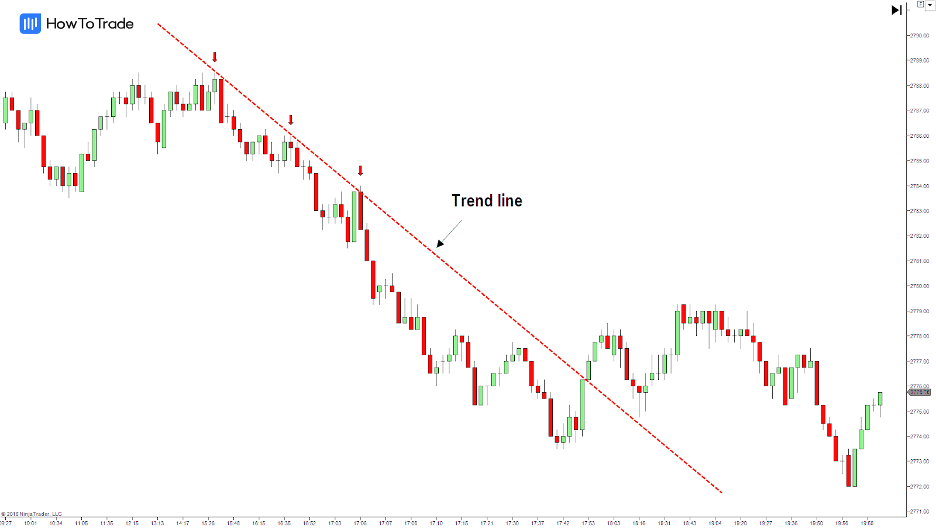
Let’s see what it would look like on an actual stock chart.
How to Draw Trend Lines for Stock Price Analysis
Okay, so now that you know the technicals, let’s discuss how you can draw trend lines in your trading platform. It is actually super simple. All you have to do is market research, choose the stock or share you want to invest in, find three significant tops or bottoms and connect them with a single line.
Ok, that sounds easy, right? But it is really that simple.
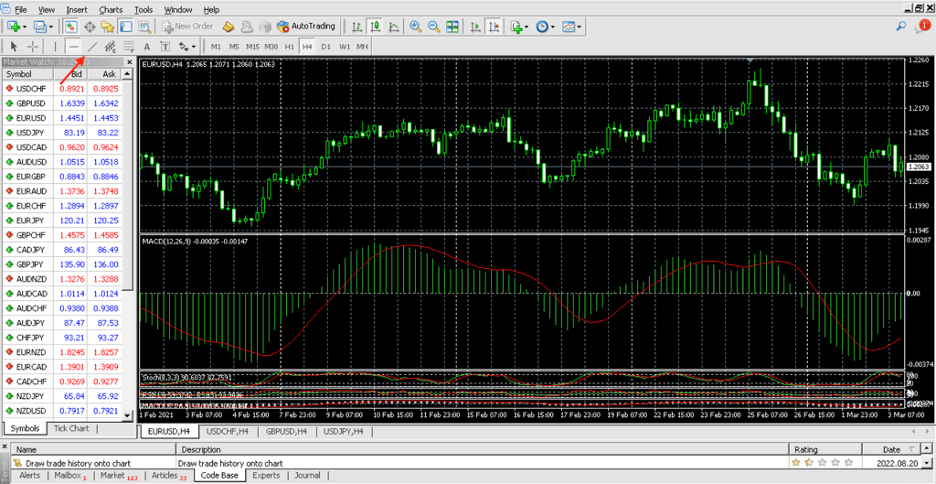
So, why don’t you try to draw your own trend lines? You can do this on most online trading platforms, including MetaTrader 4 (MT4). All you need to do is find the drawing tools and search for a straight trend line. To start drawing a trend line, click on the ‘Trendline’ option and simply drag it through your price chart.
Now, remember, when you’re drawing trend lines in a downtrend, they must be above the price. When you’re drawing trendlines in an uptrend, they must be below the price.
Sideways Trend
Yes, that’s right. There is another type of trend on top of downtrend and uptrend, and it is called a Sideways trend. Or, in other words, a ranging market.
Generally, a sideways trend is a horizontal price movement that occurs when the forces of supply and demand are nearly equal. In a sideways trend, the price moves in a narrow band and consolidates rather than going upwards or downwards.
By using support and resistance levels, you can clearly visualize a range of sideways price action where the price cannot break above a resistance level or below the support level.
Let’s take a look at what it actually looks like!
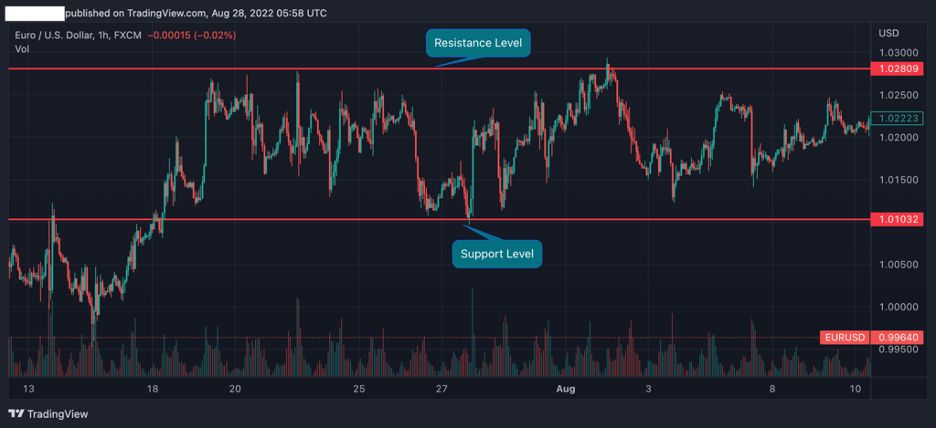
As you can see in the EUR/USD 1H chart above, the market trend is basically no trend. In trading jargon, it’s called a choppy market, meaning the market price has found an equilibrium.
Traders typically buy the asset at the support level and sell it at the resistance level. Conversely, when the price trend line breaks one of the top or bottom levels, a trader will enter a position in the direction of the breakout with the expectation that a new trend reversal will begin.
Wrapping Up
In summary, trend lines are an excellent way to analyze stock price movements and find entry and exit levels. As we mentioned in this lesson, there are three types of trends in the stock market:
- Uptrend lines (higher lows)
- Downtrend lines (lower highs)
- Sideways trend lines (ranging)
And remember, it takes a minimum of two tops or bottoms to draw a valid trend line, but it takes THREE to confirm a trend line. Our investment advice – Use it. Trend lines are a valuable technical analysis tool for finding successful trades in financial markets.
In the following lessons, we will show you how to use moving averages in stocks and Fibonacci retracements levels. These are helpful technical analysis tools to confirm the trend line break.
Most importantly, by the end of this course, you will know how to combine all stock indicators and create your tool kit for finding trading opportunities. Let’s move on to the next lesson!


Up To $5,000 Credit!
- Trade 1,000’s of global markets.
- 0% deposit and withdrawal fees.
- Rapid funding turn-around times.
- Trade on MetaTrader 4 and 5.