Using Moving Averages to Find the Trend
As we touched upon in the previous chapter, you can use moving averages to determine trend direction in forex by looking at how the indicator interacts with a price. The easiest way to do this? By simply plotting a simple moving average on a pricing chart. In doing so, you can scrutinize your simple moving average and figure out exactly in which direction the market is moving.
Understanding The Trend Moving Average Indicator
Perhaps the single greatest use for a moving average is in the identification of trends. In fact, thousands of trading strategies are based on using moving averages to identify the direction and strength of price action. This may be done routinely by observing the location of the price to a moving average and the slope of the line itself.
Best of all, we can use any number of inputs to define our moving average, and indirectly, our trend. Among the most common are the opening price, median, and closing price.
Reading Bulllish and Bearish Trends
Now, it’s time to get down to brass tacks. Below are the basics of moving averages and trends:
- When a market is in an uptrend, the moving average is below the price action. Given this scenario, the market is said to be in a “bullish trend.”
- When a market is in a downtrend, the moving average is above the price action. Given this scenario, the market is said to be in a “bearish trend.”
When trading the forex in real-time, it’s imperative that one is able to interpret the relative strength of a bearish or bullish trend on the fly. To do so, we use the following guidelines to quantify price action:
- If the moving average expands further from the price, it indicates that a strong trend is present.
- If the moving average move converges toward the price, the trend is becoming weak.
In reality, the two tendencies listed above are the basis for many a forex trading strategy. For a visual example, let’s take a look at the bullish trend illustrated in the graphic below.
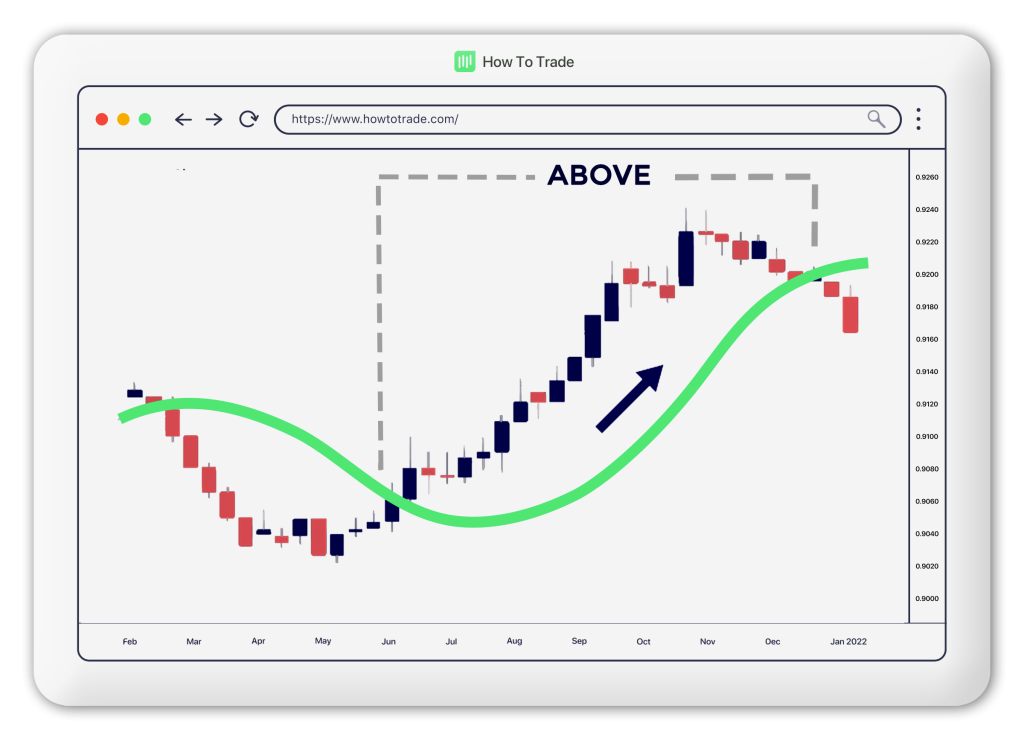
As you can see, this market is in a full-fledged uptrend as long as the price holds its position away from the moving average. However, when price action approaches the moving average, the strong current trend begins to fade. Finally, upon price action crossing the moving average, the market reversed into a bearish trend.
The same scenario mentioned above holds true in the midst of a downtrend – only reversed. When a market is in a downtrend, the price holds its position below the moving average. Then, as the market rallies toward the moving average, the downtrend fades, until price action crosses the moving average and prompts a full-blown reversal.
Reversals
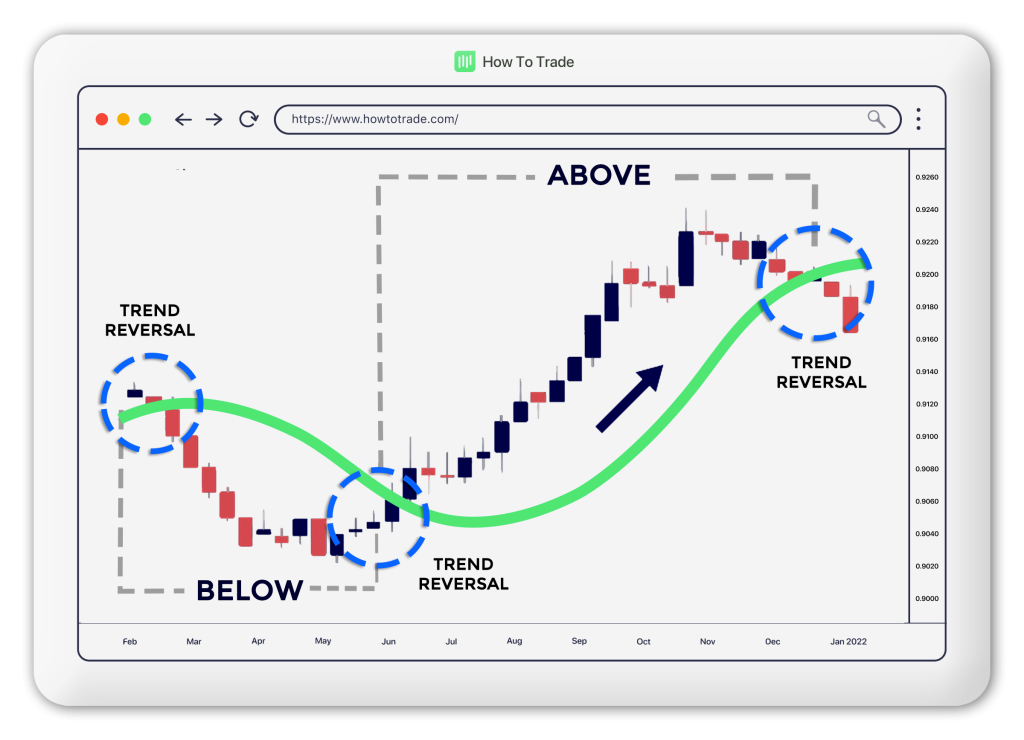
Also, it’s important to remember the following moving average rule: as the moving average approaches evolving price action, the trend is more likely to change course. This phenomenon occurs in two phases: consolidation and reversal.
For instance, let’s say that your simple moving average based on closing prices is firmly beneath the market. The trend is up; however, price action begins to fall toward the moving average. Now, volatility slows down as the market trades in closer proximity to its average price. Finally, the price crosses your simple moving average and takes on its new path. Unless there are any strong support and resistance levels influencing the price, a bearish trading strategy is now appropriate.
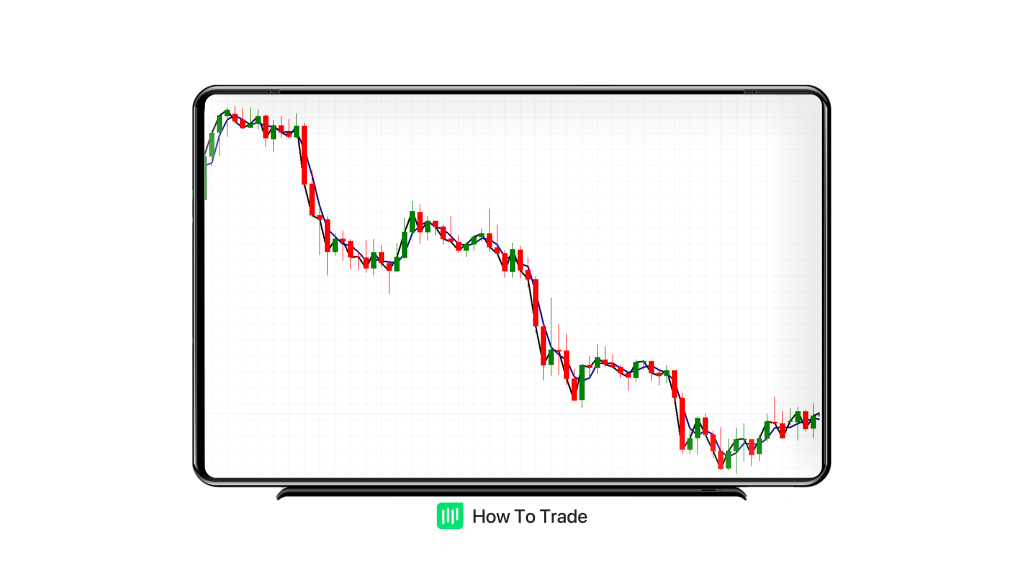
Sometimes viewing this scenario exclusive of parameters such as time period or closing prices is a good exercise. Let’s take a look at the charts below.

As you can see, volatility lessens as the price approaches the moving average. When the trend line is broken, the market enters a reversal. Now, the current trend is bearish and the best trading strategies are those that favor the downside of the market.
The problem with this method is that it is just too simple. Of course, easy is good and often the best way to cash in on the power of the moving average. Just in case, it’s always a good idea to only risk capital that you can afford to lose.
Can you Really Rely on a Moving Average?
Let’s say that EUR/USD has been in a downtrend, but an important report comes out causing it to surge higher. Now, the market is challenging the moving average and entering reversal territory. On a chart, it looks something like this:

You can see the price is ABOVE the moving average. What would you do in this situation? Would you buy or would you wait? The market is now very near its average price and tightening up. What now?
Ta-da! If you said buy, you got faked out! That’s ok – we’re only midway through the forex training course, so the mistake is forgivable!
In our example, traders reacted to the news but afterward, the trend continued and the price kept heading lower! Tricky, huh? Don’t worry, there is a way to protect yourself from getting faked out.
What some traders do, and what we suggest as well, is to plot a couple of moving averages on the same chart instead of just ONE. by doing so, you’ll get a clearer signal of whether the pair is trending up or down depending on the order of the moving averages on the price chart.
Combining the simple moving average and exponential moving average
Perhaps the best way to accomplish this feat is by combining a simple moving average and an exponential moving average. By implementing them both as chart overlays, it’s fairly easy to decipher trends, reversals, and consolidating price action.
For multiple moving average analysis, it’s critical to understand the difference between “faster” and “slower” moving averages. Basically, the faster-moving average has a shorter time period; it also adds weight to the most recent price behavior. Conversely, the “slower” moving average is one that views all price points as equal over a longer time period. A 50, 100, or 150-period simple moving average is a good example of a “slow” moving average.
Below are two quick guidelines regarding fast and slow-moving averages:
- In an uptrend, the “faster” moving average should be above the “slower” moving average.
- In a downtrend, the “slower” moving average should be above the “faster” moving average.
For example, let’s say we have three MAs: 13-day (short-term), a 55-day (medium-term), and a 150-day (long-term) MA.
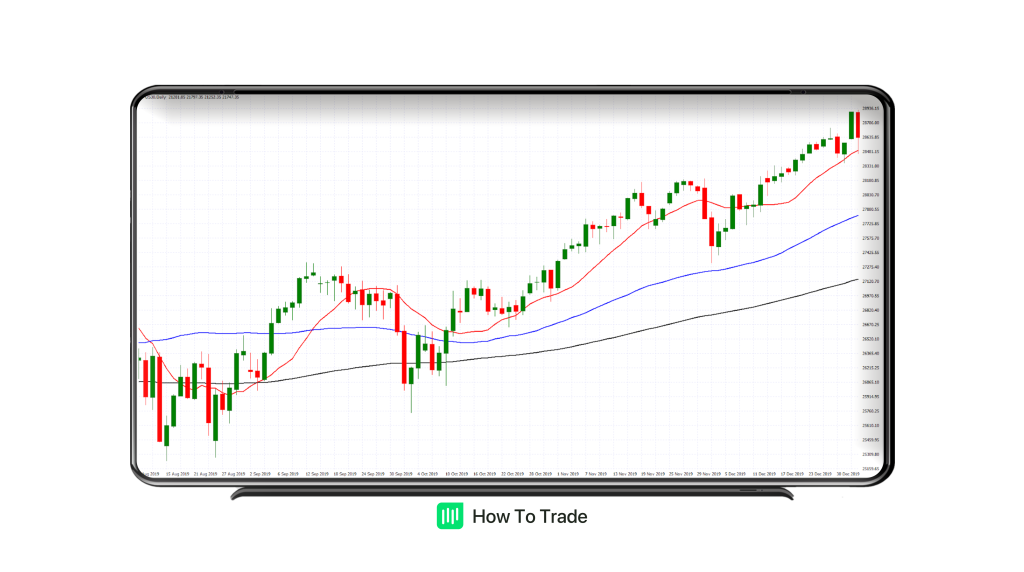
In our chart, you can clearly see that the shorter moving average (13-day MA) is more sensitive to the current price and will always stay closer in comparison to a longer moving average. Also, notice that the 13-day moving average on the chart is the line that most closely mirrors the index movement. The line furthest away from the price is the slower 150-day moving average. This contrast in location illustrates the difference between the two calculations.
Another thing to consider when assessing the strength of the trend when using multiple moving averages is whether two moving averages are moving away from or toward one another. The concepts of divergence and convergence can be key elements when evaluating a market’s average price.
For example, in the second half of the chart above, you can see the red moving average moving further away from the blue moving average (i.e. the difference between them is increasing), thus illustrating robust trend strength. This may be referred to as divergence. If the blue and red moving averages were to approach one another, the trend would be weakening. This phenomenon would be known as convergence.
Summary
By combining this moving average tutorial with your knowledge of other technical indicators, you can begin building strong trading strategies designed to buy or sell currency pairs. But, more on that later!
For now, why don’t you have some fun plotting different MAs on your chart and see how they change over time. Maybe throw in some other support and resistance levels or even plot two exponential moving averages on the same chart. Why not? The choice is yours!


Up To $5,000 Credit!
- Trade 1,000’s of global markets.
- 0% deposit and withdrawal fees.
- Rapid funding turn-around times.
- Trade on MetaTrader 4 and 5.