How to Use Moving Averages as Dynamic Support and Resistance Levels
You should know by now the importance of support and resistance. So, what have moving averages got to do with supports and resistances? After all, a moving average is just an average of closing prices over recent periods.
Well, moving averages are powerful indicators. They can serve as both key dynamic support and resistance levels.
Notice how we said ‘dynamic’? That’s because this lesson isn’t about conventional support and resistance levels. It’s about DYNAMIC support and resistance. There’s a big difference between the two and how they are applied to evolving price action.
What Is Dynamic Support And Resistance?
We know about support and resistance as horizontal lines or diagonal trend lines, but the idea of dynamic support and resistance is different. In fact, it’s a discipline all its own!
The main difference between dynamic support and resistance and standard support and resistance levels is that the former are constantly changing with price action. Basically, as the price moves, so do dynamic support and resistance levels. This is especially applicable to products that are consistently volatile and active.
Applications Of Dynamic Support And Resistance
In practice, dynamic support and resistance levels are applied to assets in the stock market, futures, and forex markets. The concept can be a powerful tool for identifying entry and exit points. Dynamic supports and resistances are invaluable for placing seemingly chaotic price actions into context.
For instance, forex traders frequently use a moving average as a market entry point. Although one of the simplest trading strategies, currency traders will buy a specific pair when the price dips and tests the moving average. Conversely, they’ll sell if the price rises and touches the moving average. Although this isn’t an iron-clad trading strategy, it isn’t a bad way of entering the market with consistency!
However, before we go any further, it’s important to add a caveat: dynamic support and resistance are not nearly as strong or indicative as horizontal and diagonal support and resistance. Even though it’s a reputable indicator, a solid horizontal support or resistance area can be a much better bullish or bearish trading signal.
From a functional standpoint, we don’t recommend ever using moving averages all by their lonesome to define support and resistance levels. It’s typically always better to confirm tendencies in price action with at least one other indicator.
Having said that, dynamic support and resistance levels do have their uses.
How to Use Moving Averages as Dynamic Support And Resistance Levels
Choose any Moving Average indicator, define its inputs, and apply it to price action. And that’s exactly how to add dynamic support and resistance to your chart!
Here, we have a daily EUR/USD chart, and we’ve popped on the 10-period exponential moving average (EMA). Let’s see if it serves as dynamic support or resistance.
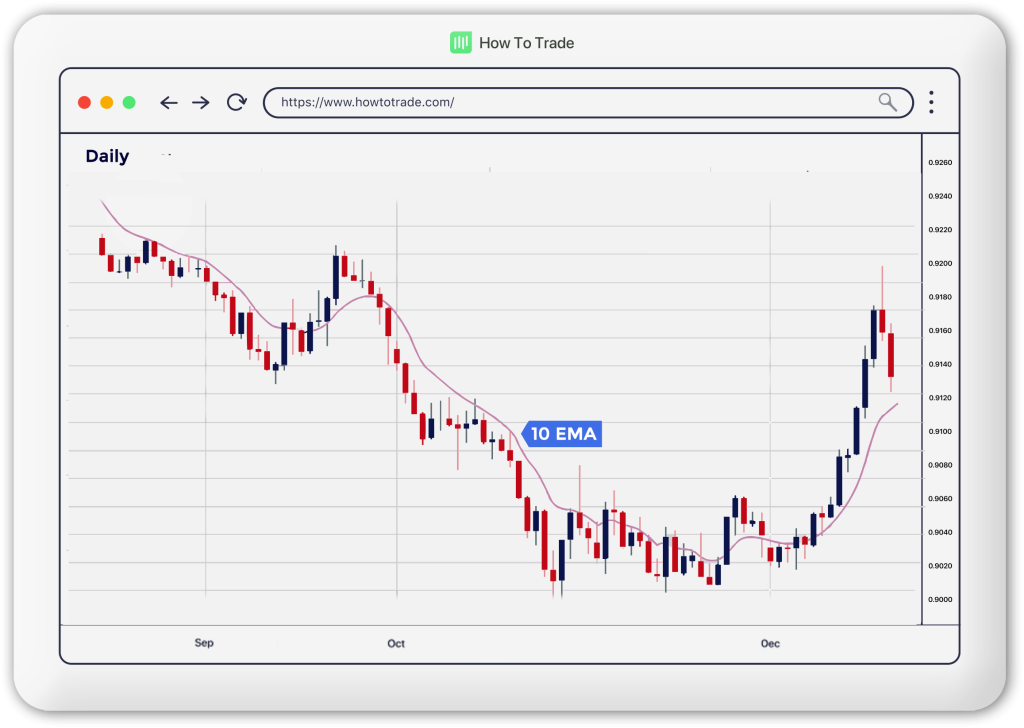
As you can see, the 10 EMA resistance level held really well for most of the downtrend. Almost every time the price approached the 10 EMA and tested it, it acted as resistance, and the price bounced back down. Pretty amazing, huh?
Of course, no indicator, not even the exponential moving average, is infallible. The price will not always immediately bounce off a moving average set up as dynamic support or resistance. Sometimes, it will go a little more before returning to the direction of the main trend. In other cases, the price smashes through such levels altogether.
Using Moving Averages to Form Multiple Dynamic Support And Resistance Levels
Some Forex traders add more than one moving average to a chart and only buy or sell once prices are in the middle of the space between the two moving averages. This area is called ‘the zone’. As always, this strategy is only one way to skin a cat and does not constitute investment advice.
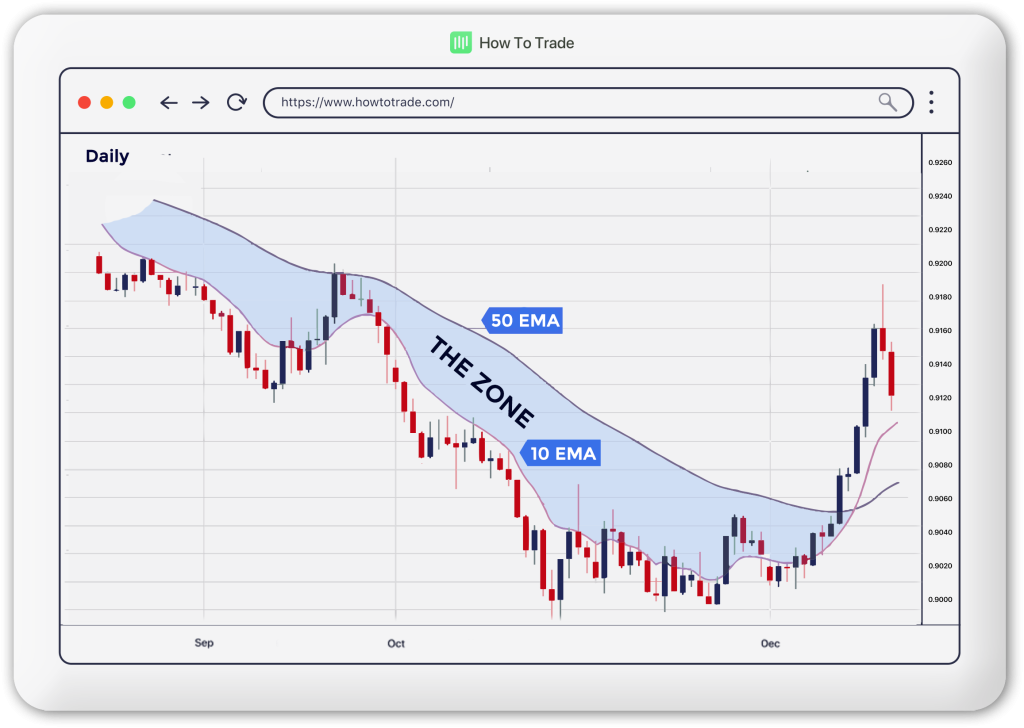
Let’s take another look at the daily EUR/USD chart. This time, however, let’s combine the 50 EMA with the 10 EMA to gain a multi-indicator view of the market.
Once we include the 50 EMA, we can see one key point: although the 10 EMA level was broken, the 50 EMA level held firm during that brief rally in September. This confirms the direction of the prevailing trend.
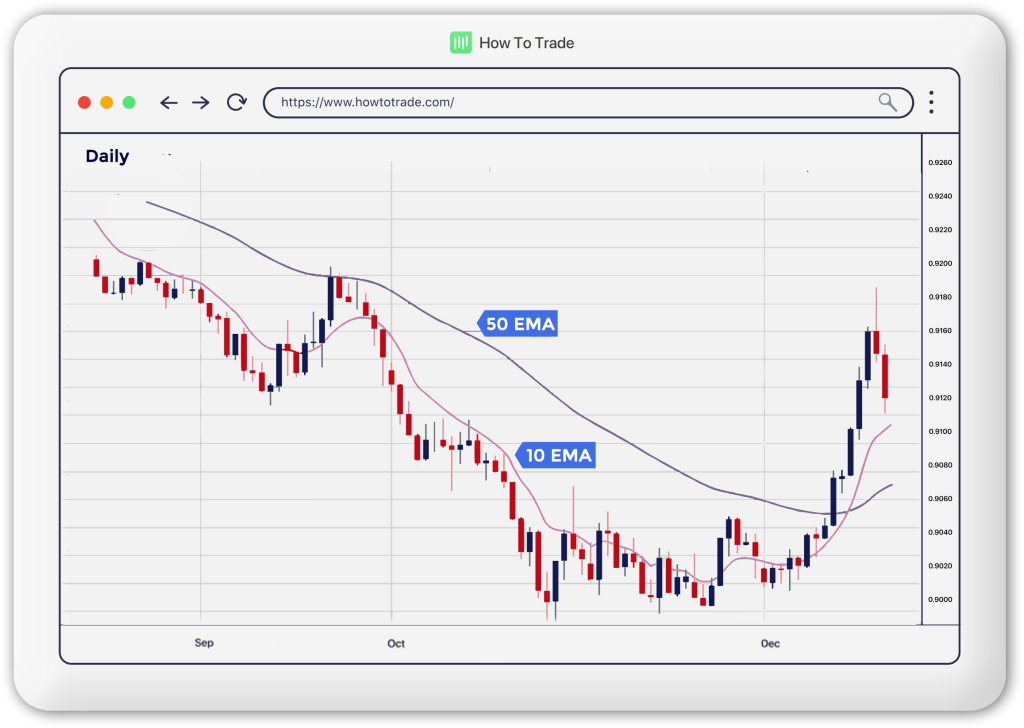
Adding the 50 EMA also throws up a strong crossover signal at the end of a period of consolidation in November and early December. This signal turned out to be a precursor for a bullish rally, occurring just before the market entered an uptrend.
The idea is that just like the classic horizontal support and resistance areas, these moving averages should be treated as zones or areas of interest. In fact, the area between moving averages could be considered a zone of support or resistance all by itself.
Why Do Dynamic Support And Resistance Levels Work?
The reason moving averages are so powerful as support and resistance levels are similar to the drivers of price action theory in technical analysis. Ultimately, it all comes down to peer pressure and the fact that thousands and thousands of traders use moving averages.
And, out of all the moving averages traders use, there’s only a handful of common ones. The result is a feedback loop when the indicators themselves gain relevance. Why? Because legions of dedicated traders favor them!
90% of traders who use moving averages use one or more of these five periods:
- 10
- 20
- 50
- 100
- 200
So what happens when 90% of traders who use moving averages use one of these five?
Well, nothing, really…
But what happens when 90% of those using moving averages use one of these AND have come to expect it to act as dynamic support or resistance?
I think you know the answer…
Price will generally respect these moving averages in some way, right? It’s self-fulfilling, or rather group-fulfilling.
But, like anything else in Forex, there are no guarantees. These moving averages are just another tool you can use.
Key Takeaways
- Any moving average can be used as dynamic support and resistance levels.
- You can use a single line of the moving average indicator as your dynamic support and resistance level. Alternatively, you can combine more than one moving average indicator to form support and resistance zones.
- Some of the most commonly used moving average periods for this purpose are 10, 20, 50, 100, and 200.
Summary
Remember, you can’t build a house (or, in our case, a consistent track record) with just one or two tools – you need the whole toolbox. That’s why your trading strategies must be armed with a collection of powerful fundamental and technical analytics.


0% Commission Accounts
- Trade 1,000’s of global markets.
- 0% deposit and withdrawal fees.
- Rapid funding turn-around times.
- Trade on MetaTrader 4 and 5.