Many would argue that large-cap equity indices represent a basket of stocks with exceptionally high profitability ratios and balanced growth; thus, these indices are less correlated with economic activity and can often be detached from economic reality. For example, indices that comprise a small number of firms, like the Dow Jones 30 or NASDAQ100, are essentially biased to rise – when one stock is not performing well, another ‘more profitable’ company is going to replace it. And when the index is that small, every company matters. In a way, these indices are designed to rise over the long term.
The Russell 2000, on the other hand, is a stock index that consists of 2000 small and mid-size companies from different industries. This formation makes the Russell 2000 an ideal index for representing the US economic situation at any given moment and, perhaps, the ideal barometer for measuring the economic performance of the US economy and other equity indices.
 Table of Contents
- What is the Russell 2000 and Why Is It Such an Important Index?
- Is Russell 2000 a Leading Indicator for US Equity Markets?
- Russell 2000 vs US GDP (Global Financial Crisis)
- The Problem With Using Economic Data
- Using Russell 2000 As a Leading Indicator for Major US Indices
- Why is Russell 2000 the Best Barometer for the US Economy and Equity Markets?
- How to Trade the Russell 2000
What is the Russell 2000 and Why Is It Such an Important Index?
The Russell 2000 (RUT) is a stock index that measures the performance of 2000 small-cap US stocks. Small-cap companies are more common, with a market capitalization of less than $2bn. As a result, this makes the index more volatile than the S&P500 and so on. The potential for growth in these companies is usually higher than in mid and large-cap stocks, but with this comes greater risk. Think of it as more of an up-and-coming stock.
Generally, the Russell 2000 is widely perceived as the benchmark for small-cap stocks and is often being used as a barometer for the US economy. Once a year, in June, the index is reconstituted, meaning companies are removed and added. This has caused lots of debate in the past and will continue to do so. This is a tradable index, but what if I told you there is a powerful way to use it?
Is Russell 2000 a Leading Indicator for US Equity Markets?
Well, yes. The Russell 2000 and 3000 are often viewed as leading indicators for US equity markets. Since the Russell 2000 index covers a wide range of companies that are not large or mega-cap stocks, it has a higher correlation with the US Growth Domestic Product (GDP) and economic activity.
This correlation can be attributed to several factors. First, while large-cap stocks operate internationally, small-cap stocks are more affected by domestic changes in the US economy. Secondly, small-cap stocks are far more sensitive to interest rate changes since labor and borrowing costs can significantly impact their revenues. At last, the Russell 2000 is constructed to provide a more comprehensive and unbiased barometer of small-cap companies in the US equity market. Think about it: 2000 small-cap companies that are unknown to the public – clearly, these stocks can better represent the economic reality.
So, all things considered, the Russell 2000 is certainly an excellent barometer or a leading indicator for the US economy and equity market.
Russell 2000 vs US GDP (Global Financial Crisis)
During times of economic uncertainty, much like the times we are in today, history shows that it can be beneficial to look at the Russell 2000 as an indicator for economic growth or recession. This is because the Russell 2000 comprises small-cap companies that are more sensitive to shocks in the financial system.
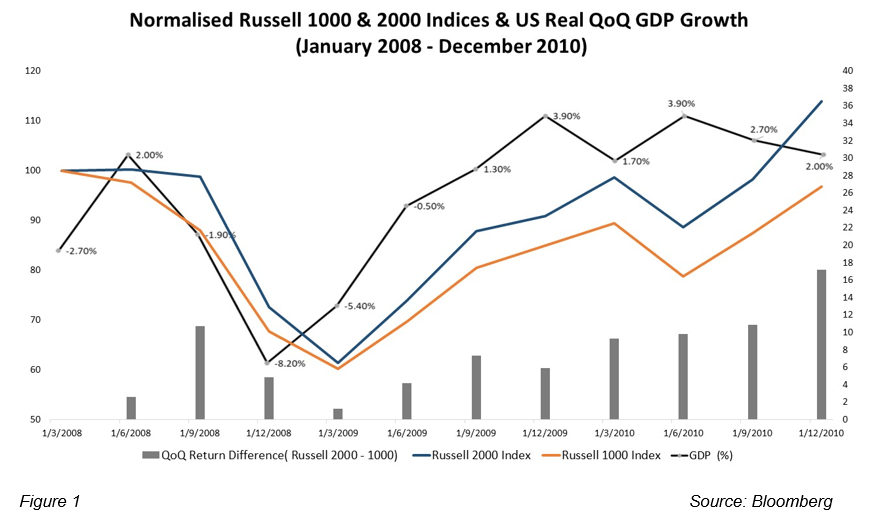
The chart above shows how closely correlated the Russell 2000, Russell 1000, and US GDP (%) were during the financial crisis. During this time, stocks across the board fell dramatically. Still, it was the Russell 2000 that was the first mover, showing its potential power as a leading indicator for the economy and/or other risk indices.
The Problem With Using Economic Data
Many media headlines, speculation, and traders’ interests focus on analyzing economic calendars. There is often a perception that because a certain data figure just came out, it will determine the future price of a market.
For example, it is common for traders to go down a similar thought process to “US CPI was only 3% last month, that means stocks will rise today” when actually, this data is about the past. The markets are forward-facing, meaning that projections for the future drive the price. Of course, if the actual figures are way off the forecasted figures, then there has been a mispricing, but if it is roughly in line, we shouldn’t use it to determine the future price of our favorite assets. Instead, we could look at Russell 2000 to better understand US equity performance.
Using Russell 2000 As a Leading Indicator for Major US Indices
So, practically, how can you use the Russell 2000 to predict price movements of other major US indices?
It’s pretty simple; you can use the asset correlation trading strategy. The idea of this strategy is to follow two assets with high correlation and look for trading opportunities when the two assets move in opposite directions.
Now, since the Russell 2000 is the more ‘reliable’ asset, you are going to take trades based on the signals provided by Russell 2000.
Let’s take a look at the chart below, comparing the Russell 20000 and NASDAQ100.
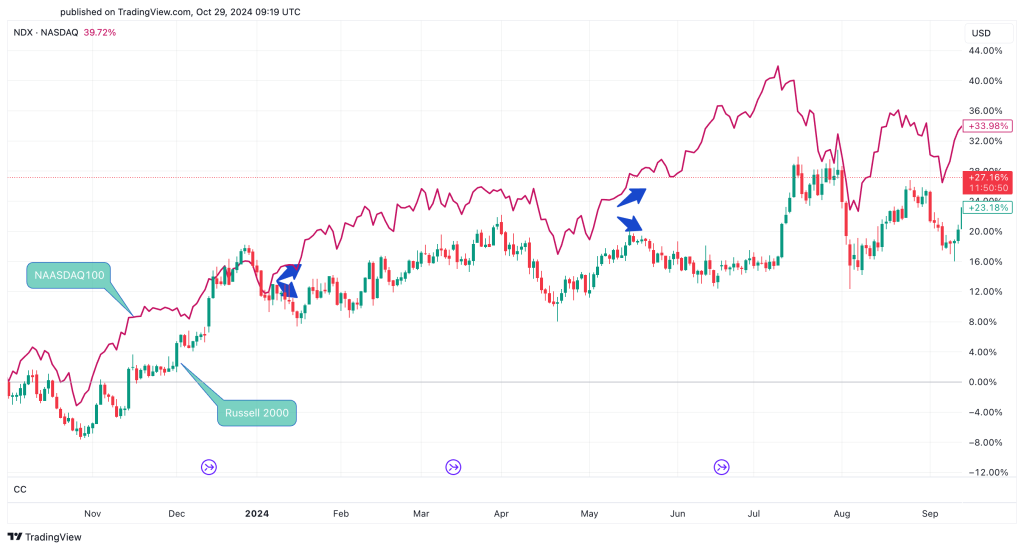
As you can see, the two assets are typically correlated; however, when the two assets lose correlation (the blue arrows), a trade signal is given. When this happens, you can use the Russell 2000 as the market barometer for US100 and other major US indices.
For instance, if we look at the chart above, we can see that around mid-May, the Russell 2000 and NASDAQ100 lost correlation. A good trade here would be to short-sell the US100 and buy the Russell 2000.
Why is Russell 2000 the Best Barometer for the US Economy and Equity Markets?
The big difference between major US stock indices and the Russell 2000 is the way they are constructed and the way each index reacts to economic development.
The Dow Jones, 30, NASDAQ100, and even the S&P500 are heavily weighted by large companies that are typically profitable and more resilient to economic growth/recessions or slowdown. In that sense, most companies listed on these indices tend to have consistent revenues, regardless of the economic condition. On the other hand, the Russell 2000/3000 is highly affected by a downturn/growth in the economy, and as such, it tends to react before the largest US indices.
This makes the Russell 2000 the ideal market barometer for the US economy and equity markets. When the economy performs well, the Russell 2000 tends to outperform major US indices. This phenomenon is also known as the great rotation, whereby investors decide to rotate out of large-cap stocks into small-cap stocks. Meanwhile, when an economic slowdown occurs, the Russell 2000 is likely to be the first instrument to lose value.
So, when considering all the above, the Russell could be used as a barometer for understanding the US economic health and as a leading indicator for other major US indices.
How to Trade the Russell 2000?
Trading the Russell 2000 index can be done in various ways. The first option is via futures contracts by trading the E-Mini Russell 2000 futures on the CME exchange. Another option is to trade Exchange-Traded Funds and index funds tracking the Russell 2000 index performance. Lastly, traders can also trade the Russell 2000 through CFDs (Contracts for Difference). For more information on opening a CFD trading account and trading the Russell 2000, visit SwitchMarkets.
Risk Disclosure: The information provided in this article is not intended to give financial advice, recommend investments, guarantee profits, or shield you from losses. Our content is only for informational purposes and to help you understand the risks and complexity of these markets by providing objective analysis. Before trading, carefully consider your experience, financial goals, and risk tolerance. Trading involves significant potential for financial loss and isn't suitable for everyone.


