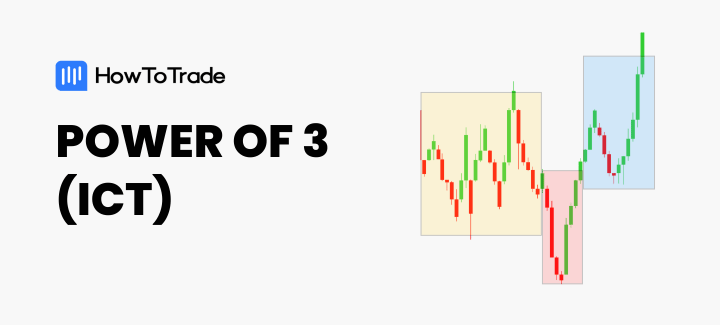
- The ICT Power of 3 concept aims to expose the tricks and methods of the Smart Money traders to retail traders
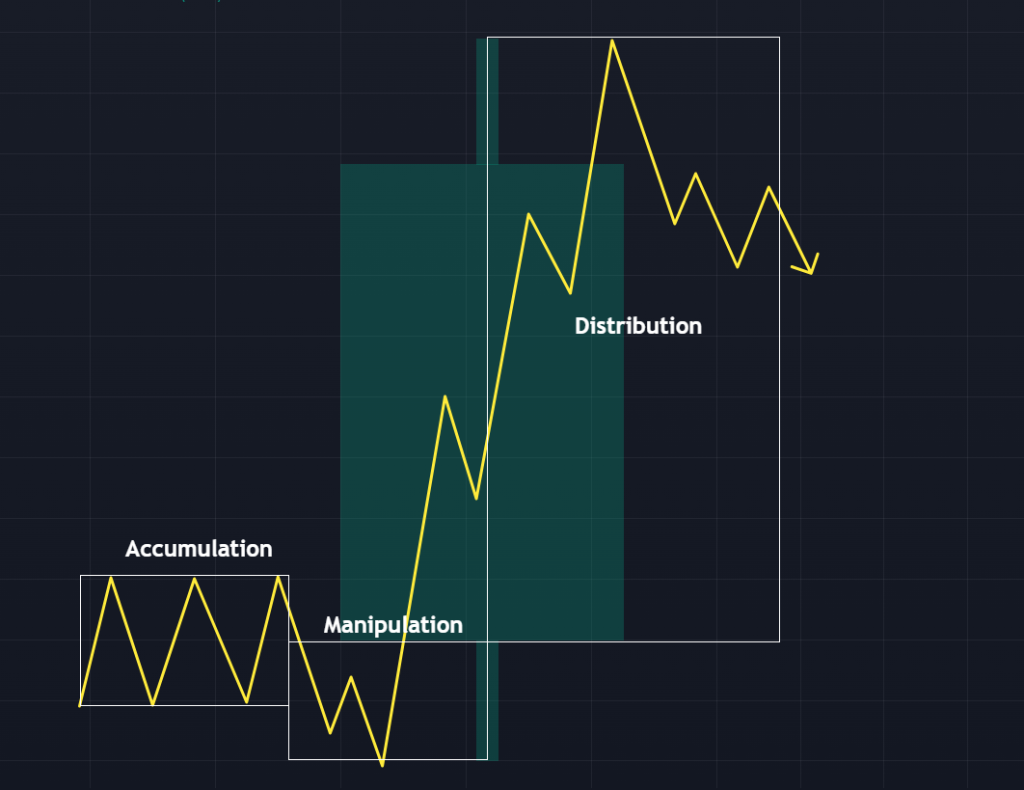
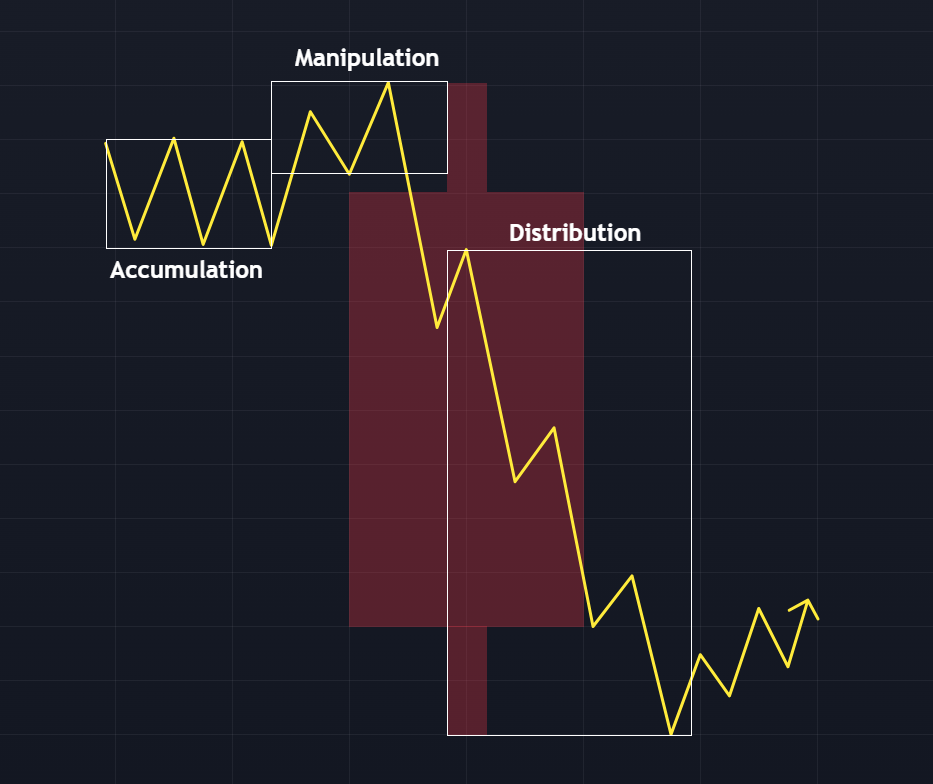
- The Power of 3 is in three phases: accumulation, manipulation, and distribution
- A good understanding of these phase and how they play out can help retail traders time their trades to limit losses and maximize profits
The ICT Power of 3 trading concept aims to expose the tricks and methods used by the Smart Money to retail traders. This way, retail traders are able to time their entries and avoid taking trades when and where they’re likely to lose.
In this blog post, we will explore the ICT Power of 3 in detail, discussing each of its phases and providing practical tips on how to effectively incorporate this concept into your trading strategy.
You’ll learn:
- What the ICT Power of 3 is
- The various phases of PO3 trading
- Applications of the PO3 on the chart, and
- How to trade the PO3
- What is the ICT Power of 3?
- What is the Logic Behind the ICT Power of 3?
- What are the Main Phases of the Power of 3 (PO3)?
- The ICT Power of 3 Application: The Candlestick Formation
- How to Trade Using the ICT Power of 3
- What are the Benefits and Limitations of the ICT Power of 3?
- Tips on Using the ICT Power of 3
- Final Note
What is the ICT Power of 3?
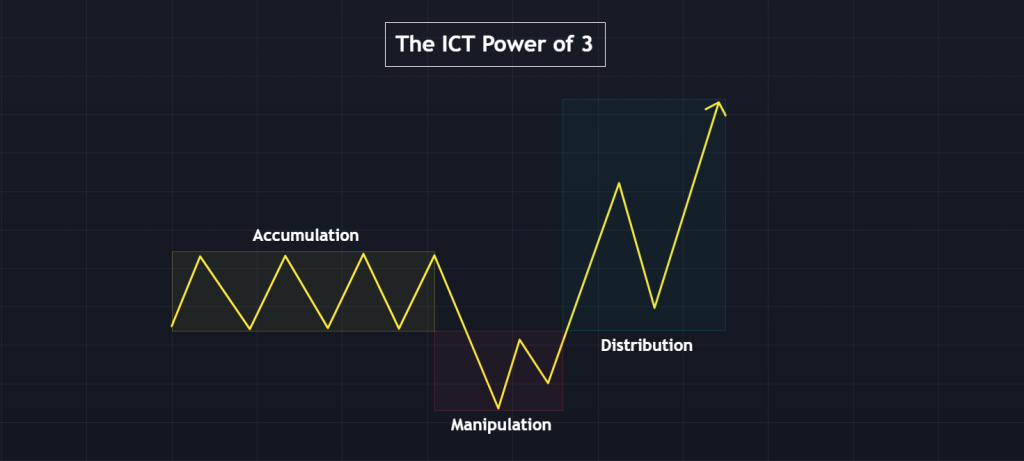
The ICT Power of 3 is a trading concept popularized by Michael Huddleston, also known as “The Inner Circle Trader” (ICT). This concept is designed to help traders identify and exploit market phases driven by the actions of large institutional players, often referred to as “smart money.”
The Power of 3 framework breaks price action into three phases: Accumulation, Manipulation, and Distribution. And by knowing how to identify these three phases, you can improve your ability to anticipate market movements, avoid common traps, and align your trades with the true direction of the market.
We’ll get to these distinct phases in a bit. But before that, let’s explain how the Power of 3 works and why (if) it works.
What is the Logic Behind the ICT Power of 3?
The ICT Power of 3 is rooted in the understanding that large institutions and smart money, who have the resources and information to move prices to their advantage, often manipulate the markets. These entities use the Accumulation and Manipulation Phases to build and disguise their positions before the real move happens during the Distribution Phase. And retail traders, who often rely on conventional indicators and strategies, are frequently caught off guard during the Manipulation Phase, causing them to lose trades.
The ICT Power of three is also heavily influenced by market psychology. The Accumulation Phase preys on traders’ impatience, the Manipulation Phase exploits their emotions, and the Distribution Phase rewards those who understand the game. This cycle mirrors the broader psychological journey of market participants, making it a powerful tool for those who can grasp it.
Now, let’s describe the three phases of the Power of 3.
What are the Main Phases of the Power of 3 (PO3)?
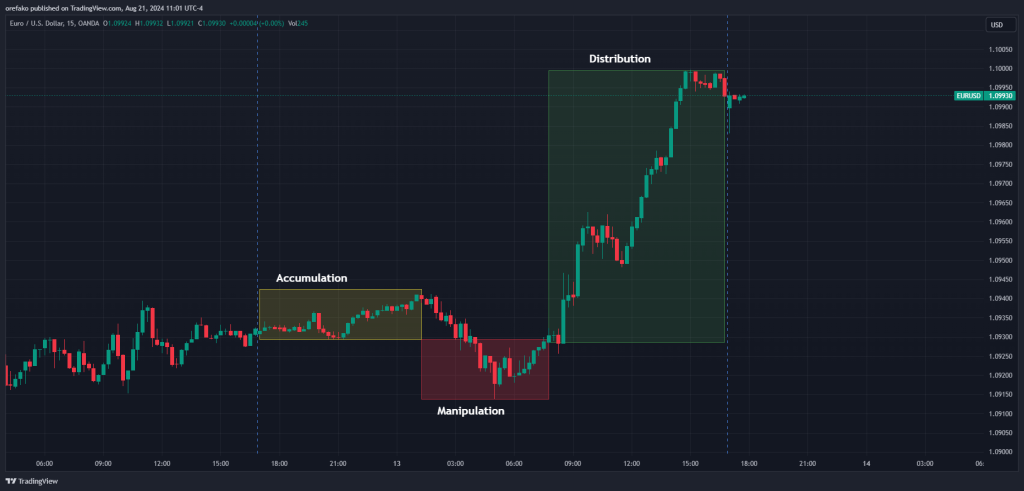
As we already mentioned, the three phases of the ICT PO3 are Accumulation, Manipulation, and Distribution. Here’s what each means.
1. The Accumulation Phase
The Accumulation Phase is the first of the three stages in the ICT Power of 3 concept, where the market shows signs of consolidation or accumulation. During this phase, the smart money builds positions in a particular asset. These entities are not yet ready to move the market significantly but are quietly accumulating assets without causing noticeable price shifts.
If you can accurately identify this phase, you are better positioned to anticipate the market’s next move: manipulation.
Characteristics of the Accumulation Phase
These are the signs that characterize the Accumulation Phase.
1. Range-Bound Movement
During the Accumulation Phase, the market trades within a narrow range, where price action fluctuates between defined support and resistance levels. In this phase of range-bound movements, you’ll often find small candlesticks with low volume. This is a sign of the lack of strong buying or selling pressure.
2. Low Volatility
Volatility tends to be low during this phase as the market consolidates. The lack of significant price movement can make the market appear indecisive, but this is often a deceptive calm before the storm.
3. Volume Patterns
Volume during the Accumulation Phase may be relatively muted compared to other phases, but it can offer clues to savvy traders. You might observe volume spikes near the support and resistance levels, indicating that smart money is either buying into support or selling at resistance within the range.
4. Time of Day and Market Context
The Accumulation Phase often occurs during quieter trading periods, such as the Asian session in the forex market. During this session, major market participants prepare for the more volatile London and New York sessions.
2. The Manipulation Phase
The Manipulation Phase is the second stage in the ICT Power of 3 concept, where the market appears to break out of its accumulation range but does so deceptively. During this phase, the market will trap and manipulate retail traders into trades in the wrong direction, then target their stop-loss, creating false signals that lead to premature entries and exits. This phase is characterized by sharp, often sudden movements that seem to confirm a new trend. But in reality, they are designed to shake out weak hands before the real move occurs.
Characteristics of the Manipulation Phase
Here are those things that are characteristic of this manipulation phase
1. False Breakouts
The Manipulation Phase often begins with a false breakout from the range established during the Accumulation Phase. You’ll notice the price move sharply above resistance or below support. Retail traders mark this move and think a breakout and a potential new trend is finally happening. However, this move is often short-lived and quickly reverses, trapping traders who entered on the breakout.
2. Stop-Hunting
During manipulation, the market seeks to trigger the stop-loss orders placed by traders just outside the accumulation range. This stop-hunt flushes out weak positions, providing liquidity for larger market participants to execute their trades at favorable prices.
3. Rapid and Erratic Price Movements
The Manipulation Phase is often marked by swift and erratic price movements that can be confusing and disorienting. These moves are designed to create emotional reactions, leading to impulsive trading decisions.
4. Increased Volume
Volume typically spikes during the Manipulation Phase as stops are triggered and new traders enter the market. However, this volume can be misleading, as it doesn’t necessarily indicate the start of a genuine trend but rather the execution of orders from manipulated market participants.
3. The Distribution Phase
The Distribution Phase is the final stage in the ICT Power of 3 concept, where the market moves decisively in the intended direction after the manipulation in the opposite direction has shaken out weak hands. This phase is characterized by a clear trend, either bullish or bearish, as the smart money participants begin to distribute their positions for profit. Unlike the previous phases, the Distribution Phase typically exhibits strong momentum and is where the most significant price action occurs.
Characteristics of the Distribution Phase
Here are the signs that follow the distribution phase:
1. Clear Trend Direction
The Distribution Phase is marked by a clear and sustained trend breaking market structure in the intended direction of the smart money. Whether it’s an upward or downward movement, the market moves with purpose, following the path initially hinted at during the Manipulation Phase.
2. Increased Momentum
Momentum picks up significantly during the Distribution Phase. You’ll likely start seeing candlesticks with larger bodies, increased trading volume/volatility, and fewer deep pullbacks. You’ll also find the high probability trade setups in this phase.
3. Breakout Confirmation
Unlike the false breakouts in the Manipulation Phase, breakouts during the Distribution Phase tend to be genuine. The price breaks past significant levels of support or resistance and continues in the direction of the market trend, confirming the breakout with follow-through.
The ICT Power of 3 Application: The Candlestick Formation
What does the typical candlestick look like? It has a body, one wick on the top, and one wick on the bottom. Remember that the wicks signify how the asset has moved between the open and close during your timeframe.
For a bullish candlestick, for instance, you’ll notice that the price opens, goes lower, suddenly rallies to form the body of the candlestick, and then settles for the close.
And for a bearish candlestick, you’ll observe that the price first rallies, drops significantly to form the body, and finally settles for the close.
This move is a typical Power of 3!
How to Trade Using the ICT Power of 3
Trading the Power of 3 is easiest when you can predict the direction of the next candlestick that’s about to form. For example, if you’re on the weekly timeframe, you’re able to predict the bias of the next weekly candlestick.
For intraday trading, you’ll try to predict the next daily candlestick to derive something called a “daily bias.” Once you have this daily bias, you dip into a smaller timeframe to try to catch the distribution phase of the move. Why? Because the distribution phase is where the market makes its actual move.
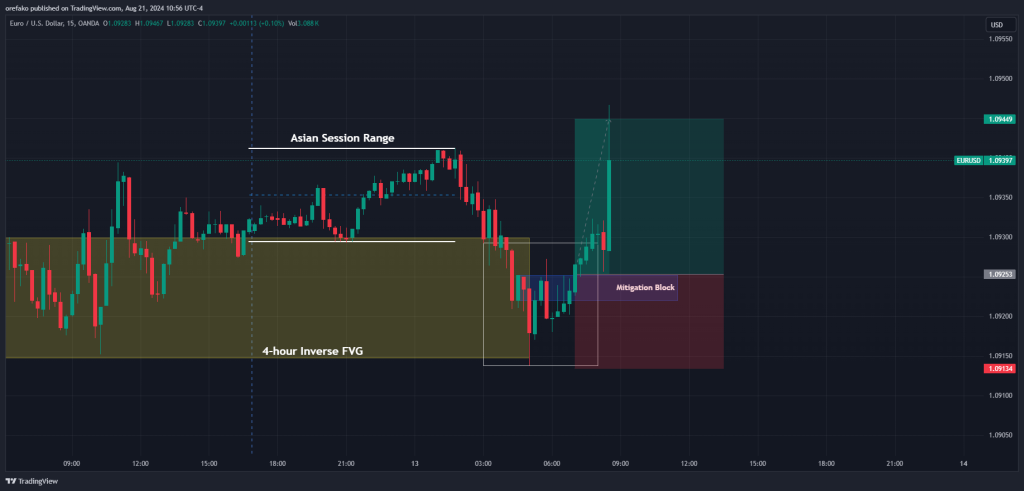
Let’s break down this example of the EURUSD trade into various steps.
1. Predict Your Higher Timeframe Daily Bias
When we know what the potential future price movements are on the higher timeframe, we can go to a lower timeframe to scout a Power of 3 move.
Let’s take our EURUSD example.
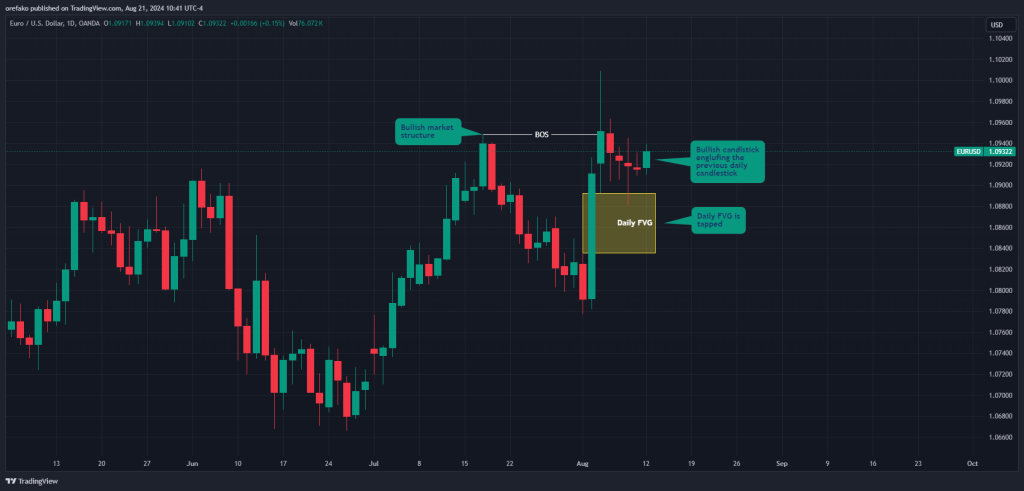
What are we likely to see as we go into the 13th of August trading session? What’s our daily bias?
- First, we notice that the trend is bullish. We know this because we see the price breaking market structure to the upside.
- We also noticed that a huge daily Fair Value Gap was tapped two days before. When an FVG gets tapped this way, it will likely be a demand level pushing the price back up.
- Next, we see that the 12th of August was bullish, engulfing the bearish 9th of August candlestick before it.
- For now, our next daily candlestick will likely be bullish.
Don’t fall into the trap of overanalyzing your higher timeframe bias, especially if you’re a day trader. You only need to predict the next day’s candlestick, not the ultimate price trend. As such, you can simply look at the immediate price action surrounding the current price to gauge a potential next move.
2. Mark out Potential Points of Interest (POI)
Since you have predicted where the market will likely go with your daily bias, you can anticipate the direction of the manipulation. But knowing where to place your entries is another thing. One way to do this is to mark out potential Points of Interest where the price might manipulate to before reversing. This POI could be an order block, a mitigation block, a breaker block, a fair value gap, or whatever it does for you. You can also mark out this POI on any timeframe as long as it’s the same or higher than your entry timeframe.
If, for instance, you’re taking your trades on the 15-minute timeframe, you can start marking out POIs on any timeframe between the 15-minute and the daily (since we’re using a daily bias). Just know that the lower the timeframe, the more POIs you get. And the more POIs you get, the higher the chances that many are only inducement levels.
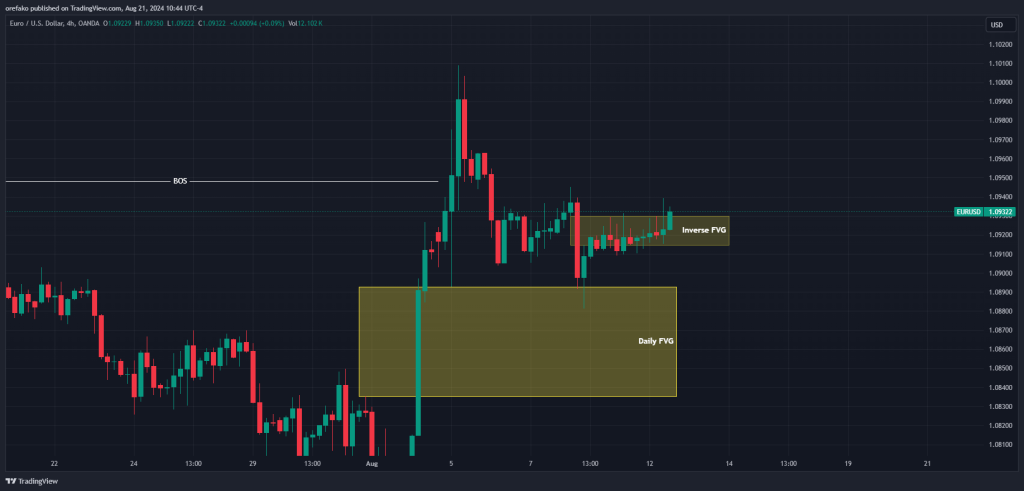
For our EURUSD example, we know that our daily bias is bullish, and we expect the next candlestick to be bullish. We next go to the 4-hour timeframe to mark out any Points of Interest. We notice that a Fair Value Gap from the previous price swing has been inverted. That’s a sign that the price is likely to reverse.
3. Wait for Accumulation and Manipulation
Now that we have our daily bias and our potential reversal point, what’s next is to await your accumulation and manipulation.
For forex charts, the Asian session is often the accumulation phase, especially for the non-AUD and JPY pairs. The reason is that the Asian session has the least trading volume for those pairs, hence less volatility. You’re also likely to get a range-bound movement during this trading session. All of these are markers of the accumulation phase.
Next is the manipulation. For a bullish daily bias, you’re expecting a bearish manipulation, preferably one that falls lower than the support of the Asian range. And for a bearish trade, you’re looking for a bullish manipulation, preferably one that rises higher than the resistance level of the Asian range. This manipulation will often occur during the early London session or just before. But this is not a given. Sometimes, the manipulation lasts until the New York session.
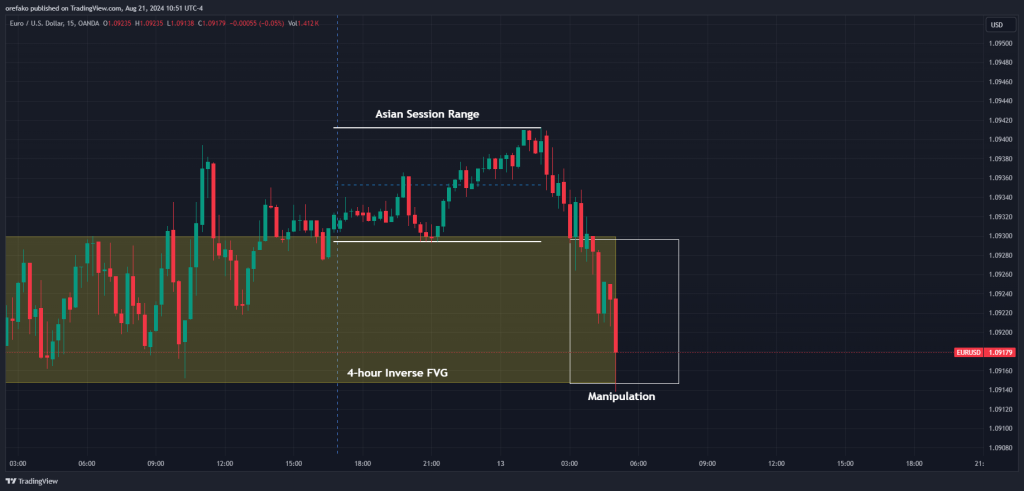
Let’s return to our example for a minute. See that the Asian range shows signs of “dead-ness” with low volatility. That was our accumulation. Then came the manipulation, where the price suddenly broke downwards, mimicking a bearish breakout
4. Wait for signs of Reversal and Enter Your Trade
How do you know if the manipulation is over? You don’t know. But you can look for signs of reversal. And that’s where your trade entry comes in.
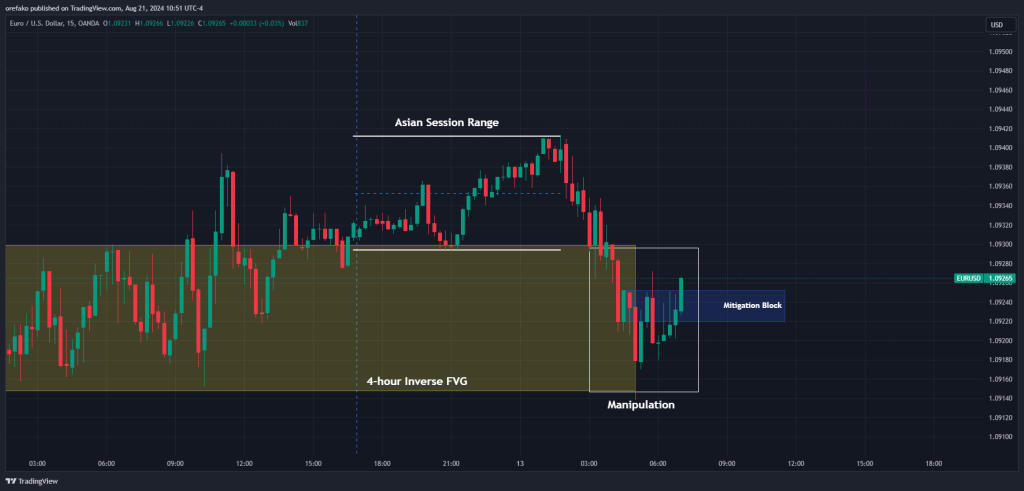
In our EURUSD example, notice how the price manipulates into our potential reversal POI. And when it gets here, the market changes character, leaving a mitigation block behind. This is a clear sign that the price is likely about to reverse.
We then place our trade entry at the top of the mitigation block in anticipation of the distribution. If you like, you can place yours on the fair value gap. Your entry model depends on you. What matters is that you get into the trade at a price level that’s comfortable for you.
5. Manage your risk
Your risk management is just as important as your trade entry. Ideally, you want to place your stop loss below the newly formed swing low (in a bullish market) or swing high (in a bearish market). But if you’re more aggressive, you can place your stop loss below levels, such as the FVG, the Mitigation block, or whatever entry model you used.
Place your profit target on the other side of the Asian range. Remember that you have a daily basis. That means you expect the market to distribute in the direction of your daily bias. If your daily bias is correct, the price will likely close past the other side of the Asian range.
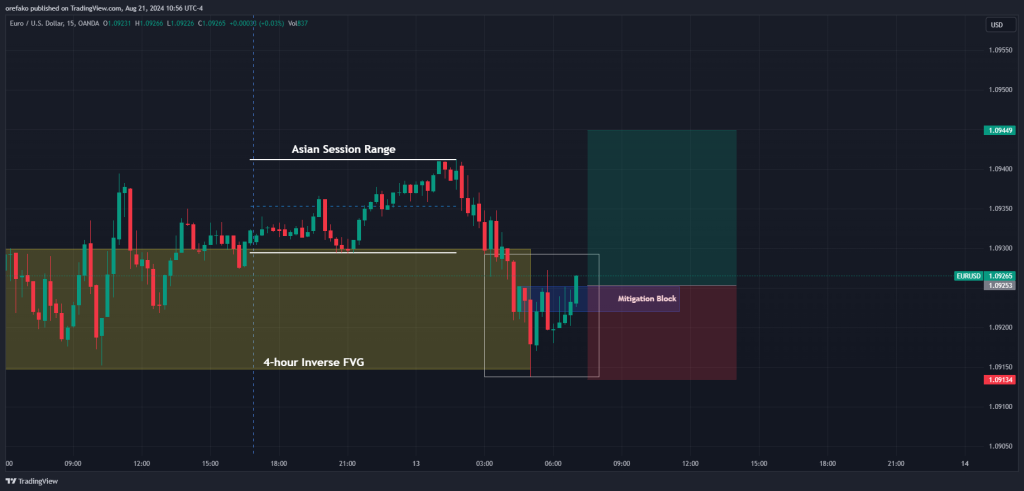
Returning to our example, our stop loss is below the swing low, and our take profit is just above the resistance side of the Asian range. See how the trade works out below:
What are the Benefits and Limitations of the ICT Power of 3?
Let’s see some of the benefits and limitations of the ICT Power of three.
Benefits of the ICT Power of 3
Perhaps the first benefit of the ICT Power of 3 to traders is that it provides a deeper understanding of market structure and market dynamics. By breaking down price action into three distinct phases—accumulation, manipulation, and distribution—you can see the bigger picture.
Another thing the power of 3 helps you with is the timing of your trade entries. By recognizing the accumulation phase, you can avoid entering trades too early. Similarly, understanding the manipulation phase helps you avoid false breakouts and stop-hunts. This point also ties in with its benefits to your risk management.
For example, recognizing a false breakout during the manipulation phase can prevent a trader from taking unnecessary risks. Additionally, knowing when a trend is likely to reverse during the distribution phase allows traders to protect their profits and avoid giving back gains to the market.
Furthermore, ICT Power of 3 is versatile and can be applied across various financial markets, including forex, stocks, commodities, and cryptocurrencies, and across multiple timeframes. As a result, day traders, swing traders, and long-term investors can rely on it.
Limitations of the ICT Power of 3
The ICT Power of 3 is a sophisticated concept that demands a solid understanding of technical analysis and market structure. As a result, novice traders may find it challenging to accurately identify each phase and apply the concept effectively.
Another limitation is the problem of subjectivity. While the ICT Power of 3 provides a structured framework, there is still a degree of subjectivity in identifying the accumulation, manipulation, and distribution phases. Different traders may interpret the same price action differently, leading to varying conclusions and potentially inconsistent results.
Furthermore, the effectiveness of the ICT Power of 3 can vary depending on market conditions. In highly volatile or trending markets, the phases may not be as clearly defined, making it difficult to apply the concept accurately. Additionally, in markets driven by external factors, such as major economic news or geopolitical events, the phases may be disrupted or less predictable.
Finally, the ICT Power of 3 is not foolproof, just like any trading strategy or concept. There will be times when the market behaves unpredictably, and the phases may not unfold as expected. False signals, unexpected reversals, and whipsaws can still occur, leading to potential losses.
Tips on Using the ICT Power of 3
As you try to identify and use the Power of 3, here are some tips you should consider.
1. Master the Basics of Price Action
Before diving deep into the ICT Power of 3, ensure you have a solid understanding of price action. This includes recognizing key price patterns, understanding support and resistance levels, and being able to read candlestick formations. The Power of 3 relies heavily on price action analysis, so mastering these fundamentals is essential.
2. Use Multiple Timeframes for Confirmation
The ICT Power of 3 can be observed across various timeframes, but it’s essential to use multiple timeframes to confirm your analysis. For instance, a phase that appears on a 15-minute chart might look different on a 1-hour or daily chart. Using various timeframes helps you align your trades with the broader market context and avoid false signals.
3. Combine with Other Tools
While the Power of 3 is powerful on its own, it can be further enhanced when combined with other trading tools such as Fibonacci retracements, supply and demand levels, and volume profile analysis. These tools can help refine the identification of phases and provide additional confirmation for trade setups.
3. Patience and Discipline
The Power of 3 requires patience and discipline, as traders need to wait for each phase to unfold before taking action. This means resisting the temptation to jump into trades too early, especially during the Accumulation and Manipulation Phases, and instead waiting for the Distribution Phase to capitalize on the trend.
4. Don’t Ignore the Broader Context
Traders focusing too narrowly on the price action without considering the broader market context may misinterpret the entire Power of 3 move. Understanding market sentiment, key levels, and the behavior of major players can help avoid this mistake.
Final Note
The ICT Power of 3 is a versatile and powerful tool for traders, but its effectiveness hinges on how well it is understood and applied. It’s beyond just knowing its phases. It demands a deep understanding of price action, patience to wait for the right opportunities, and discipline to manage risk effectively.
So, when you’re using the concept, use it as a foundational tool in your trading arsenal, but stay curious, stay disciplined, and keep evolving as a trader.
Risk Disclosure: The information provided in this article is not intended to give financial advice, recommend investments, guarantee profits, or shield you from losses. Our content is only for informational purposes and to help you understand the risks and complexity of these markets by providing objective analysis. Before trading, carefully consider your experience, financial goals, and risk tolerance. Trading involves significant potential for financial loss and isn't suitable for everyone.