


The S&P 500 futures completed a six-day losing streak last Friday, its longest losing streak since early 2023. The downward pressure is a result of geopolitical tensions and sticky inflation. Today, S&P500 futures edge higher as the focus shifts to the earnings of major corporations.
Key Points
- The S&P 500 closed lower for the sixth consecutive day on Friday. Today, the SP500 breaks the 6-day losing streak with an increase of 0.51%.
- Middle Eastern geopolitical tensions, sticky inflation, and delayed-for-longer rate cut possibilities have primarily contributed to this dip.
- Focus shifts to company earnings set to be released this week.
- Key support and resistance levels are 4997.25 and 5053.50, respectively.
S&P 500 Daily Price Analysis – 22/04/2024
It’s been six days since the S&P 500 printed a green candle after a fall of 0.9% last Friday, bringing its total loss to 3.17% for that week. Since the beginning of Q2, the index has shed half of what it gained in all of Q1. And although its futures price is up by 0.51% today, the CNN Money Fear and Greed index remains low.
Among the reasons for this continuous loss are the interest rate situation and geopolitical tensions in the Middle East. Inflation has remained higher, and concerns over persistent inflation in the US weigh on US stock markets. Fed Chair Powell said last week, “If higher inflation does persist, we can maintain the current level of (interest rates) for as long as needed.”
For the week ahead, there’s a slew of important economic data positioned and investors attention will shift to leading companies earnings results. Major corporations, including Alphabet, Meta Platforms, Tesla, Microsoft, and American Airlines, will release their earnings this week.
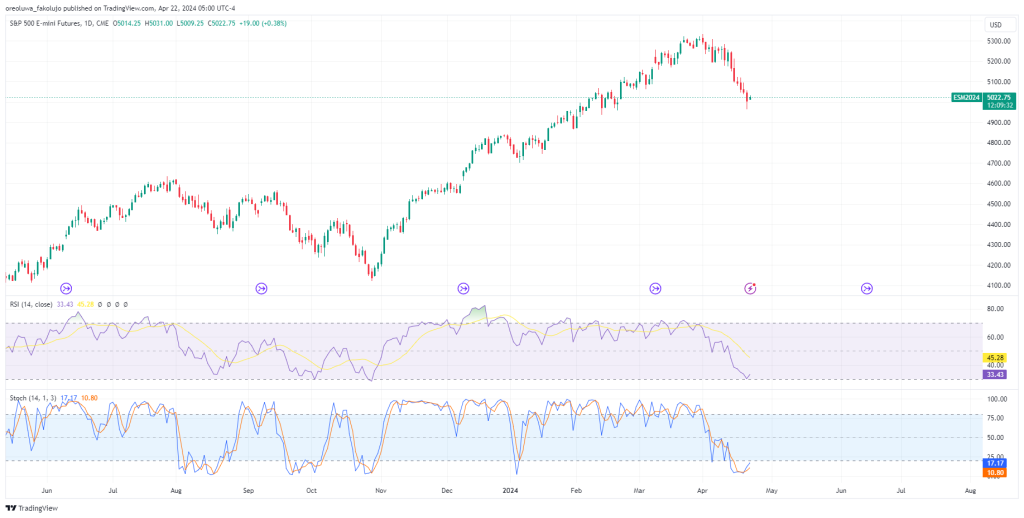
From a technical perspective, the Relative Strength Index (RSI) has edged lower that it now rests just above the oversold line. Further decline in index price could cause the RSI to dip into the oversold section. The Stochastic indicator isn’t as lenient on the price as the RSI has been, though, having dipped into the oversold region for over a week.
Overall, technical indicators suggest that the S&P500 is in a clear bearish trend with a key support level at 4963.
S&P500 Intraday Technical Analysis – 22/04/2024
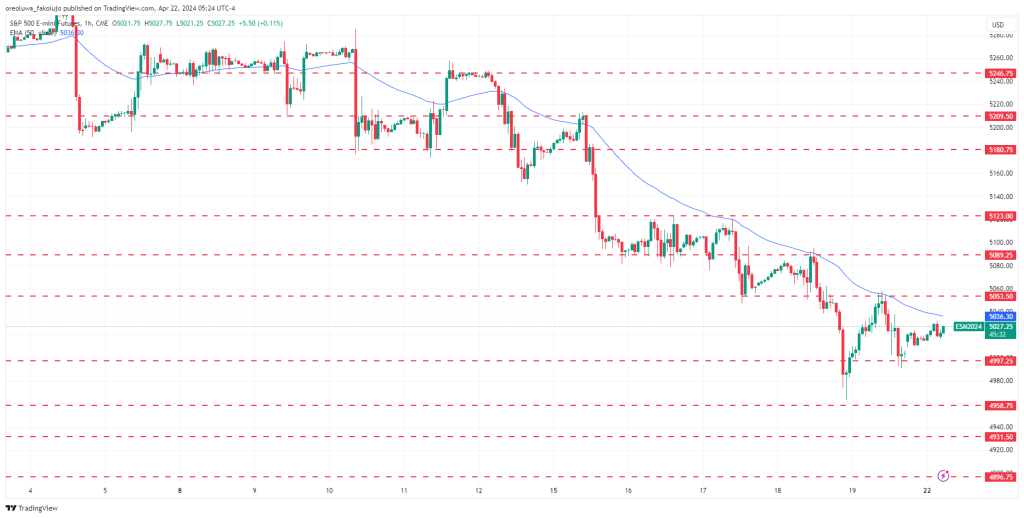
The index continues to march downwards on the hourly chart. As we predicted, all the support levels we had for the price have been broken. What’s left are even more support levels from which the price might orchestrate a reversal or a pullback, at the least. These levels on the 1H chart include 4997.25, 4958.75, 4931.50, 4896.75, and 4866.25.
On the upper side of the chart, key resistance levels include 5053.50, 5089.25, and 5123.00.
Key Economic Data and News to Be Released Today
Today, the economic calendar is rather light. But this week will be full of events, starting with Tuesday’s S&P Global Manufacturing, Composite, and Services PMI reports. The GDP and Initial Jobless Claims reports will follow on Thursday, and the Core PCE Price Index report will follow on Friday.
In addition, major S&P companies, including Tesla, Microsoft, American Airways, Meta Platforms, and Alphabet, are set to make their earnings public this week.
S&P500 Pivot Point Price Levels 22/04/2024
Based on the hourly chart, here are the key S&P 500 pivot point levels to watch as of 22/04/2024.
| S2 | S1 | Pivot Point | R1 | R2 |
| 4913.75 | 4958.75 | 5008.25 | 5053.25 | 5102.75 |
Related Articles:
Risk Disclosure: The information provided in this article is not intended to give financial advice, recommend investments, guarantee profits, or shield you from losses. Our content is only for informational purposes and to help you understand the risks and complexity of these markets by providing objective analysis. Before trading, carefully consider your experience, financial goals, and risk tolerance. Trading involves significant potential for financial loss and isn't suitable for everyone.


