


S&P 500 ended the week on a negative note last week after major banks reported a lower-than-expected performance in their Q1 reports. Investors will likely remain cautious about picking a bullish or bearish side, as the Middle Eastern geopolitical tensions have complicated things.
Key Points
- The S&P 500 lost 1.44% last Friday after below-expectation reports from major banks and geopolitical tensions in the Middle East.
- Middle Eastern geopolitical tensions may cause investors to approach the market cautiously this week.
- In the pre-market hours of today, S&P 500 futures recovered some of its Friday loss.
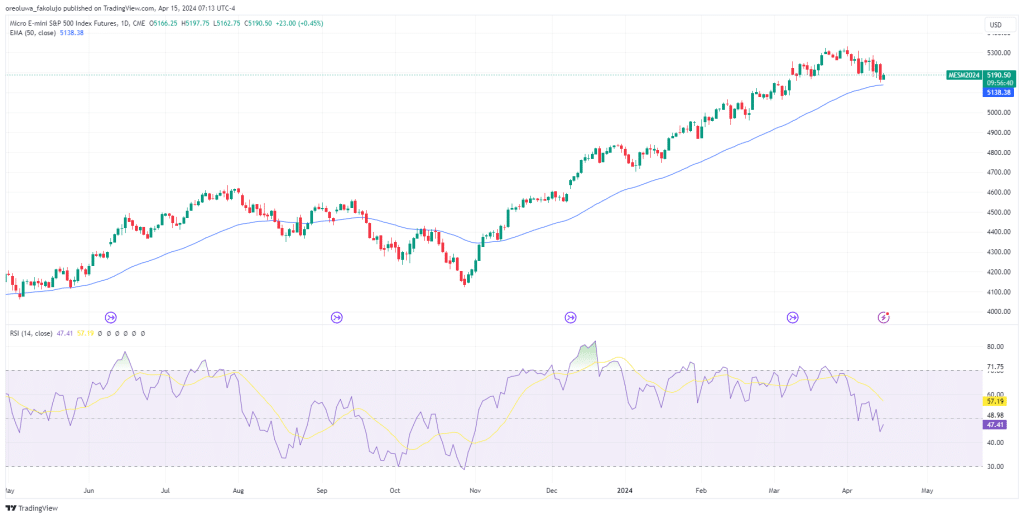
S&P 500 Daily Price Analysis – 15/04/2024
Last week ended on a bearish note for US stock indices, as major banks in the country recorded lower-than-expected performance in their Q1 reports. As a result, the S&P 500 lost 1.44% on Friday, and all its component sectors, closed the week on a negative. In the premarket hours of today, the index is currently up by 0.45%.
The overarching mood around the stock market for this week is expected to be hesitant as geopolitical tensions in the Middle East heat up. Israel insists on retaliating against Iran after the latter attacked the former. President Joe Biden, though, cautioned that the United States would not be in support of such a retaliatory attack.
From a technical perspective, the price inches closer to the 50-day EMA as the RSI line takes the dip into the negative half of the range.
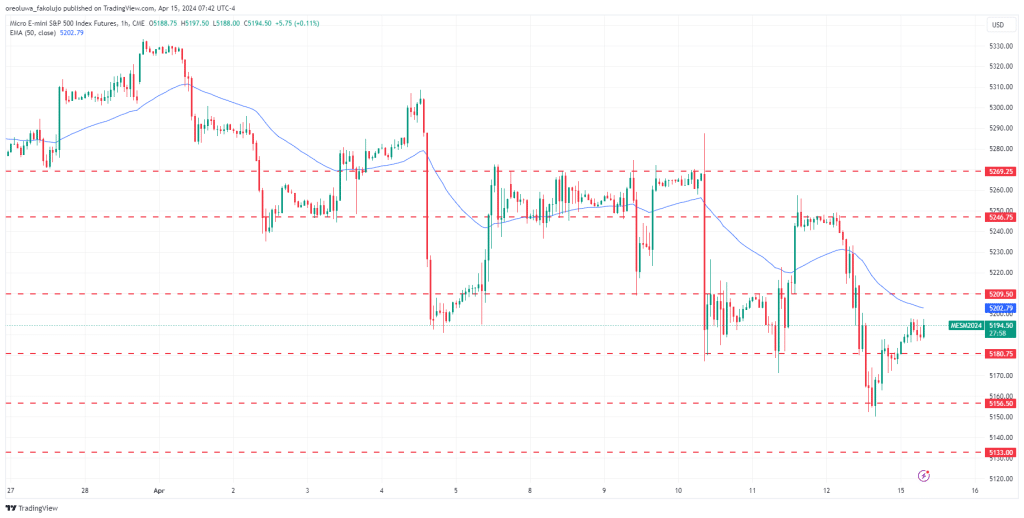
S&P500 Intraday Technical Analysis – 15/04/2024
The index continues to march downwards on the hourly chart, as we reached the lowest point in over a point last week. On its way downwards, the price left various resistance levels in its wake, including 5180.75, 5209.50, 5246.75, and 5269.25. During the pre-market hours of today, SPX futures made some recovery to climb above the 5180.75 resistance level.
From its current position, the price hangs between the 5180.75 support level (previously resistant) and the 5209.50 resistance level. If this pre-market recovery continues into the market, we may see the price go past the 5209.50 resistance level and then toward the 5246.75 and 5269.29 resistance levels. If the price continues the downward march from last week, though, the 5180.75 level could once again get broken to the downside, exposing the 5156.50 support level and then 5133 support.
Key Economic Data and News to Be Released Today
The Retail Sales data for March comes in today, and investors will use this data to estimate consumer spending for that month. If this figure comes in higher than the expected 0.4%, this may be some form of catalyst to bolster an upward movement for the index.
S&P500 Pivot Point Price Levels 15/04/2024
Based on the hourly chart, here are the key S&P 500 pivot point levels to watch as of 15/04/2024.
- P: 5201.75
- R1: 5253.25
- S1: 5115.75
Risk Disclosure: The information provided in this article is not intended to give financial advice, recommend investments, guarantee profits, or shield you from losses. Our content is only for informational purposes and to help you understand the risks and complexity of these markets by providing objective analysis. Before trading, carefully consider your experience, financial goals, and risk tolerance. Trading involves significant potential for financial loss and isn't suitable for everyone.


