


The S&P 500 index futures trade flat this morning, following three consecutive days of indecision candles. With that, technical indicators and market sentiment point to a potential pullback. Later today, investors and economists will look closely at the CPI data for guidance on the Fed’s rate cut decision.
Key Points
- The S&P 500 ended yesterday with a meager 0.13% gain, creating three consecutive days of doji candles.
- The US CPI data today might shed some insights into the inflationary pressure in the US and the Fed’s June rate cut decision.
- The general trend remains bullish, with the US500 trading slightly below its all-time high. However, technical indicators and market sentiment might indicate that a possible pullback could be near.
S&P 500 Daily Price Analysis – 10/04/2024
After so much tussle, the S&P 500 closed at just a slight increase of 0.13% on Tuesday. In the morning session, the US 500 futures edge higher, adding 0.16%.
Today’s CPI data will be in the spotlight for investors and analysts, who’ll be looking to pounce on it to get some insight into the Fed’s June rate cut decision. Already, the CME FedWatch Tool predicts that the chances of a June rate cut are only 46%.
“A delay is within the range of possible outcomes,” said Marta Norton, chief investment officer at Morningstar Wealth, “particularly if we see March inflation data surprise to the upside.” Her view corresponds to the view of Atalanta Fed President Raphael W. Bostic in an interview.
“I do think the risks are balanced,” he said, “given that the US economy has been so robust and so strong and so resilient. I can’t take off the possibility that the rate cuts may even have to move further out.”
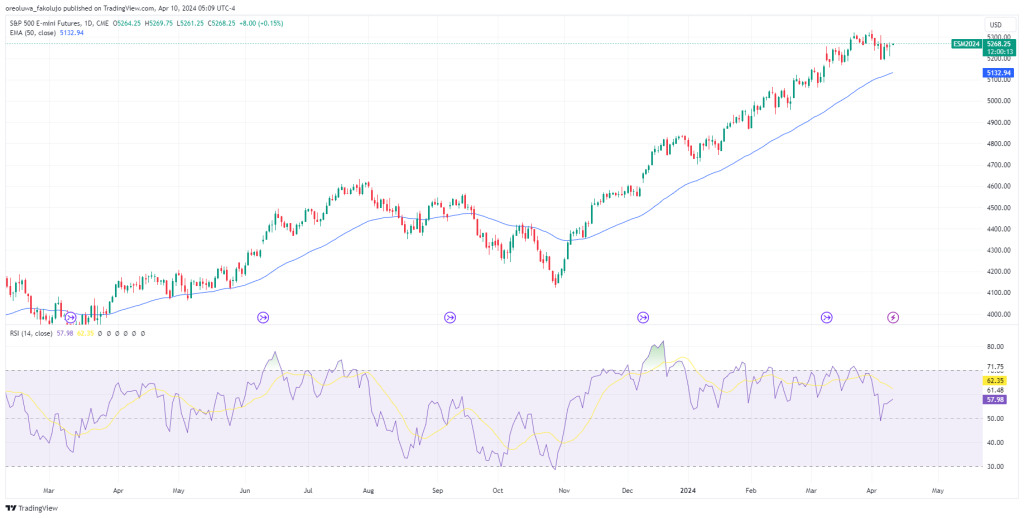
With that, along with technical indicators and the index hovering at a tight range over the past three days, there’s a possibility of a pullback. The index, which gained 9.23% since the beginning of the year and 26% YoY, seems to have lost momentum lately.
From a long-term technical perspective, the 50-day EMA and RSI both still point higher; however, a series of Doji candles, as appears in the US500 daily chart, may indicate a price reversal.
S&P500 Intraday Technical Analysis – 10/04/2024
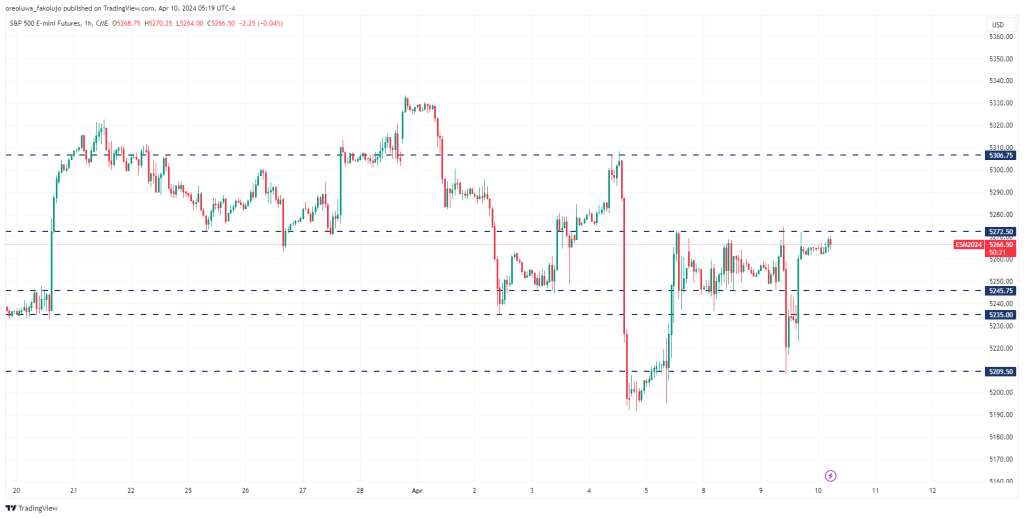
The 5272.5 price level remains crucial ahead of the market opening. Since the price broke below it last Thursday, the support-turned-resistance has solidified into a hard ceiling. If it continues to remain strong, we may see a reversal back to 5245.75 or 5235 support. Further down, we have 5209.5 support.
Should the 5275.5 ceiling break, though, the 5306.75 resistance level becomes the next target.
Key Economic Data and News to Be Released Today
Investors will be pouncing on the CPI for the March news release today in search of June rate cut guidance. If the Inflation report suggests that the US economy remains strong under the current circumstances, the chances of a June rate cut may further dip.
Later today, we’ll also get the FOMC meeting minutes and Crude Oil Inventories.
S&P500 Fibonacci Key Price Levels 10/04/2024
Based on the hourly chart, here are the key S&P 500 Fibonacci support and resistance levels to watch as of 10/04/2024.
| Support | Resistance |
| $5250.75 | $5270.25 |
| $5231.00 | $5298.00 |
| $5206.75 | |
| $5167.75 |
Risk Disclosure: The information provided in this article is not intended to give financial advice, recommend investments, guarantee profits, or shield you from losses. Our content is only for informational purposes and to help you understand the risks and complexity of these markets by providing objective analysis. Before trading, carefully consider your experience, financial goals, and risk tolerance. Trading involves significant potential for financial loss and isn't suitable for everyone.


