


US stock futures edge slightly lower on Wednesday as rate cut expectations in June have dropped since last Friday’s PCE Price Index report and a series of hawkish comments by Federal Reserve officials. Powell’s speech today and Non-Farm Payroll data on Friday are in focus.
Key Points
- Fed officials still expect rate cuts this year, but not anytime soon.
- Despite the weak start to Q2, the EMA and RSI still project a bullish long-term outlook for the index.
- The key levels for the index are the 39548 resistance and 39357 support.
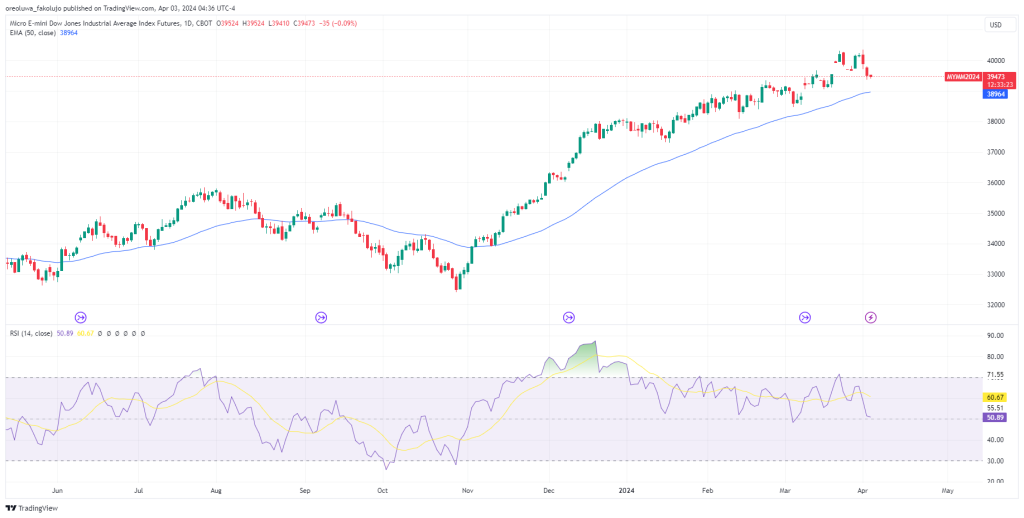
Dow Jones Daily Price Analysis – 03/04/2024
Dow Jones continued its weak start to Q2 with another losing day on Tuesday. The index dropped by 0.67% yesterday and 0.72% the day before. This drop comes after the index had one of its best Q1s in five years when it gained close to 6%. As of 12:40 GMT, DJI futures currently trades at 39479, a slight 0.06% dip from its closing price yesterday. S&P500 futures down by 0.09%, and NASDA100, down 0.13%.
The catalyst is mostly a speculation that interest rate cuts may not happen in June as many expected. After the PCE Price Index rose by 2.5% YoY last Friday, Fed Chair Jerome Powell commented that there is no need to rush rate cuts. Expectations for June rate cuts have since dropped to 62.3% from over 70% just the week before, according to the CME FedWatch Tool. Powell speaks again today, so investors will pay close attention to comments regarding the Fed’s plans. According to analysts, it appears that Fed Officials still expect that rate cuts will happen this year, but not anytime soon.
On the technical front, the bearish start to the second quarter has not been enough to stem the bullish outlook of the index, according to the 50EMA and the RSI. The RSI has been quite choppy, though, but still remains on the bullish side of the midline.
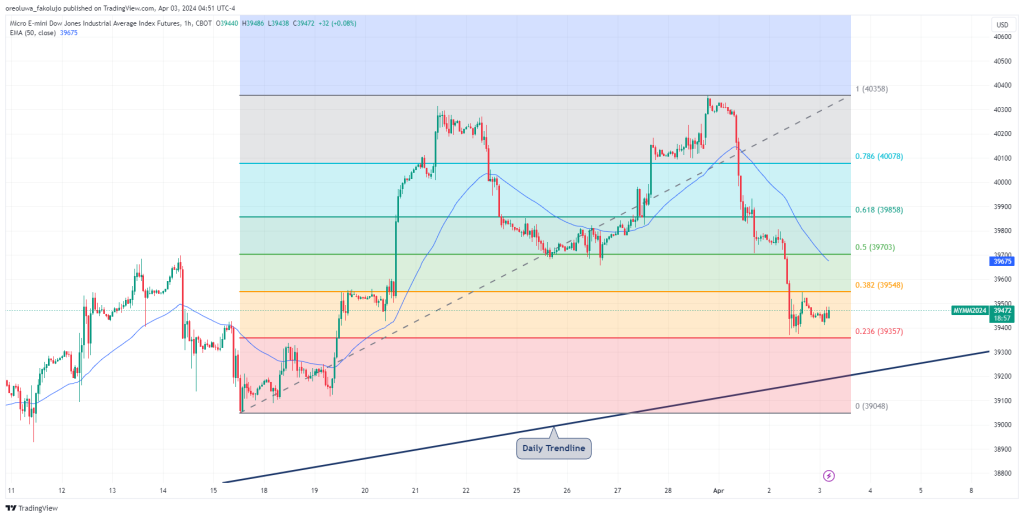
Dow Jones Intraday Technical Analysis – 03/04/2024
Looking at the 1H chart, the DJI has settled between the 0.382 (39548) and 0.236 (39357) retracement levels. These two price levels will remain crucial, as the pair has formed the habit of making such deep retracements since the turn of the year.
If the 0.236 (39357) support fails to hold, the price will have another opportunity to continue its major bullish run from the daily trend line, just underneath this support level. If these two structures aren’t strong enough to hold the price, though, the swing low of 39048 gets exposed. As seen in the 1H chart below, the index has formed a double-top pattern, and a break below 39048 can signal a downward movement.
Should the Index continue its upward trend, it’ll have to break through the 0.382 (39548), 0.5 (39703), 0.618 (39858), and 0.786 (40078) resistance levels.
Key Economic Data and News to Be Released Today
There’s a barrage of key economic data to be released today. First in line is the ADP Nonfarm Employment Change set for 8:15 AM (UTC-4). Then come the S&P Global Services PMI, ISM Non-Manufacturing PMI, and Crude Oil Inventories. Finally, Fed Chair Powell Mounts the Podium. On Friday, the Non-Farm Payrolls for March will be released.
DJI Key Fibonacci Retracement Levels 03/04/2024
Based on the 1hr chart, the key Fibonacci Retracement levels for DJI are these:
| Support | Resistance |
| 39357 | 39548 |
| 39048 | 39703 |
| 39858 | |
| 40078 |
Risk Disclosure: The information provided in this article is not intended to give financial advice, recommend investments, guarantee profits, or shield you from losses. Our content is only for informational purposes and to help you understand the risks and complexity of these markets by providing objective analysis. Before trading, carefully consider your experience, financial goals, and risk tolerance. Trading involves significant potential for financial loss and isn't suitable for everyone.


