


The poor GDP report from yesterday, mixed with sticky inflation, introduced a new component into the US macroeconomic climate: stagflation. Investors will be waiting for the Core PCE Price Index report later today to get more insight into the US economic growth.
Key Points
- Stagflation fears enter the mix, as yesterday’s GDP fell sharply below expectations, signaling a slowing economy amidst persistent inflation.
- Attention shifts to the Fed’s preferred inflation gauge, the Core PCE Price Index, as investors attempt to predict the United States’s near-term economic future.
- Key price levels are the 38,568 resistance and 38,145 support.
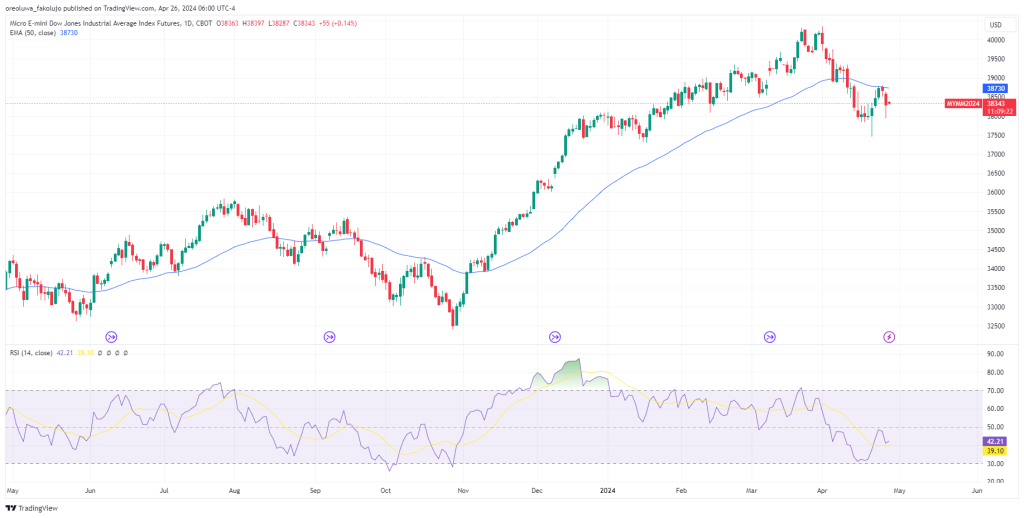
Dow Jones Daily Price Analysis – 26/04/2024
The GDP report released on Thursday showed a stark drop from expectations, which is a sign of slowing economic growth. Conversely, Core PCE prices, an adjoint report, came in hotter than expected, showing high inflationary pressures. This situation, where inflation remains sticky amid slowing economic growth, is called stagflation and is a major concern for long-term economic growth.
Unsurprisingly, the stock market took a hit yesterday. Dow Jones futures fell by 1.01%, the S&P 500 futures lost 0.5%, and Nasdaq futures lost 0.55%. Of the 30 composite Dow Jones stocks, International Business Machines Corp. (IBM) recorded the highest loss of 8.25%. Mircosoft Corporation (MSFT) and Amazon.com Inc (AMZN) lost 2.45% and 1.65%, respectively.
More than before, the focus will now be on the Core PCE Price Index reports later today, as investors and economists attempt to foresee where the US economy is headed and what the Fed’s rate cut decisions might be.
From a technical perspective, the 50 EMA proved to be a solid resistance after the price bounced back when it made contact. The RSI, which was previously edging toward the midpoint from the lower half, also took a sharp dip back to the downside. As a result, the outlook for the index, according to these two indicators, is bearish.
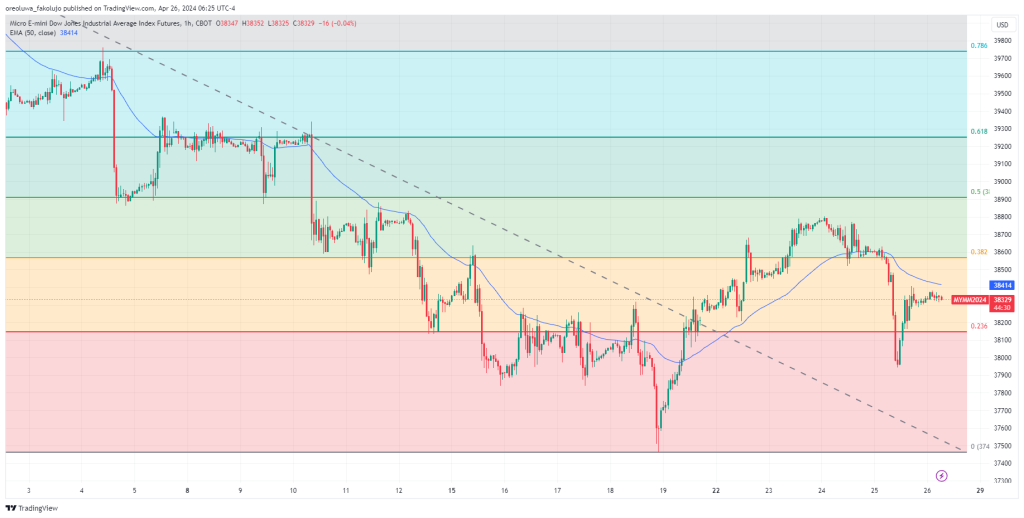
Dow Jones Intraday Technical Analysis – 26/04/2024
After falling by 7.18% from the April high of 40,358 to the low of 37,462, the index finally pulled back into a bullish correction. The Fibonacci retracement tool shows that the price went as far as 38,802, the midpoint between the 0.382 (38,568) and 0.5 (38,910) fib levels before dropping past the former.
The price now hangs between the 0.236 (38,145) and the 0.382 (38,568) fib levels. If the price finds reason to continue its upward march, it’ll have to cross the 0.382 (38,568) fib level once again, then the 0.5 (38,910), 0.618 (39,252), and 0.782 (39,738) fib levels. However, if the price continues falling, we might see the 19th of April low getting tested again.
Key Economic Data and News to Be Released Today
Attention turns to today’s Core PCE Price Index, which investors will be mulling over after yesterday’s poor GDP data. A cooler-than-expected report suggests that inflationary pressures are lessening. This might allay the fears of Stagflation. Conversely, a hotter-than-expected report could bring stagflationary concerns to the fore amidst slowing economic growth.
DJI Key Fibonacci Levels 26/04/2024
Based on the 1hr chart, the key Fibonacci levels for DJI are these:
| Support | Resistance |
| 38145 | 38568 |
| 37462 | 38910 |
| 39252 | |
| 39738 |
Related Articles:
Risk Disclosure: The information provided in this article is not intended to give financial advice, recommend investments, guarantee profits, or shield you from losses. Our content is only for informational purposes and to help you understand the risks and complexity of these markets by providing objective analysis. Before trading, carefully consider your experience, financial goals, and risk tolerance. Trading involves significant potential for financial loss and isn't suitable for everyone.


