


Gold continues to rally, influenced by prospects of U.S. interest rate cuts and ongoing geopolitical tensions, reaching $2,348.79 today.
Key Points
- Gold price climbs to $2,332.49, driven by strong demand from Chinese investors and global uncertainties.
- US economic indicators, including Core PCE and Consumer Sentiment, could sway gold’s appeal relative to the USD.
- Gold remains above the 200 EMA but faces a potential retracement from resistance at $2,352.143 due to overbought RSI.
Gold Daily Price Analysis – 26/04/2024
Gold prices have continued their upward trajectory, driven largely by increased demand from Chinese investors amidst ongoing economic uncertainties. Yesterday’s trading session closed at $2,332.49, marking a 0.71% increase from an opening price of $2,315.95. This rise can be attributed to a confluence of both local and global factors.
The recent acceleration in gold purchases by Chinese buyers, driven by fears surrounding a prolonged property market downturn and stock market instability, has been a significant bullish factor. Data released by the China Gold Association indicated that gold consumption in China for the first quarter increased by nearly 6% year-over-year, further supported by a 78% surge in gold raw material imports. This robust demand underscores the broader market sentiment that sees gold as a safe-haven asset amidst economic turbulence.
Today, gold opened at $2,332.49 and has so far climbed to $2,348.79, up by 0.70%. The sustained rally can also be attributed to global market factors, including the anticipation of U.S. interest rate cuts and persistent geopolitical tensions, which have previously pushed prices to record highs above $2,400 earlier this year.
Key Economic Data and News to Be Released Today
Today, traders will closely monitor the release of the Core PCE Price Index and the Revised UoM Consumer Sentiment in the United States. A higher-than-expected reading of the Core PCE Price Index may strengthen the USD, potentially dampening gold’s appeal as an inflation hedge. Conversely, a lower reading could weaken the dollar, making gold more attractive.
Similarly, a dip in consumer sentiment could lead to greater demand for safe-haven assets like gold, particularly if economic outlooks seem more uncertain.
Gold Technical Analysis – 26/04/2024
Gold’s price action remains bullish, consistently trending above the 200 EMA, signaling sustained upward momentum. However, the asset is currently encountering resistance at the $2,352.143 level, indicating a potential short-term challenge in its ongoing rally.
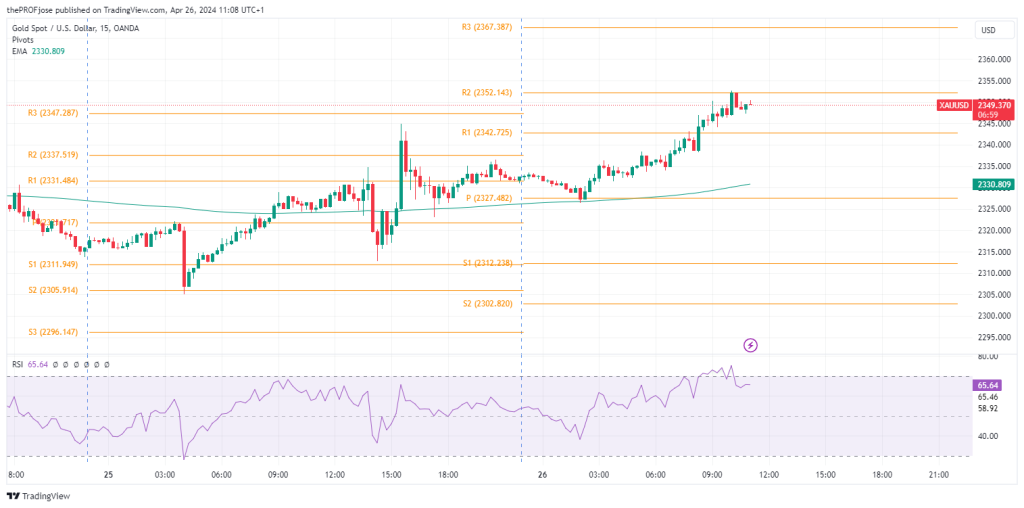
Technical indicators provide additional insights, with the Relative Strength Index positioned in the overbought territory. This suggests that gold might experience a minor retracement as the market digests its recent gains. Such a pullback could be healthy for maintaining the longer-term bullish trend.
Traders should watch the daily pivot points closely; a close below this level could signal weakening bullish sentiment and potentially invalidate the immediate bullish outlook.
Gold Fibonacci Key Price Levels 26/04/2024
Short-term traders planning to trade gold today should keep a close eye on the following key price levels for the day:
| Support | Resistance |
| 2312.238 | 2342.725 |
| 2302.820 | 2352.143 |
| 2287.577 | 2367.387 |
Related Articles:
Risk Disclosure: The information provided in this article is not intended to give financial advice, recommend investments, guarantee profits, or shield you from losses. Our content is only for informational purposes and to help you understand the risks and complexity of these markets by providing objective analysis. Before trading, carefully consider your experience, financial goals, and risk tolerance. Trading involves significant potential for financial loss and isn't suitable for everyone.


