


The USD/JPY’s fall continues following a lower-than-expected NFP report on Friday and ahead of a key BoJ meeting.
Key Points
- On Friday, the USD/JPY fell by another 0.65% after less-than-expected US job reports. On Monday morning, the Japanese Yen continued to strengthen versus the US dollar, with the pair trading -0.20%.
- Technically, the pair has a bearish outlook in the short run but remains bullish in the long run.
- The price currently hovers above the daily support level of $146.532, which may prove to be pivotal for the price today.
USD/JPY Daily Price Analysis – 11/03/2024
The USD/JPY pair fell by another 0.65% last Friday, bringing it to its fourth consecutive bearish day. This drop was mostly due to the NFP job report data from the United States, which came in lower than expectations. The data for the last month was higher than expected; however, the previous month’s data was revised to 229K from 353K. Additionally, the unemployment rate increased to 3.9% QoQ, and average hourly earnings also dropped to 0.1% QoQ.
These weak NFP report sent the US dollar lower on Friday, and the sentiment continues early this week. In addition, there are speculations that the BoJ may finally make a U-turn from its negative rates as early as this month, which may give the JPY a further advantage over the USD.
At the time of writing, the pair has further fallen to 146.668.
On Sunday night, GDP reports from Japan were the focus of investors at 19:50 GMT-4. Capital Expenditure rose by 2.0% QoQ, beating a forecast of -0.1%, and the GDP grew by 0.1% in the Quarter from -0.7% in the last quarter. While these figures are encouraging for the Japanese economy, the BoJ will be paying some attention to the 0.3% drop in private consumption.
As a result, there are talks of increasing wages to infuse some more inflationary pressure. Such a wage hike may cause the BoJ to be more likely to exit their negative rates.
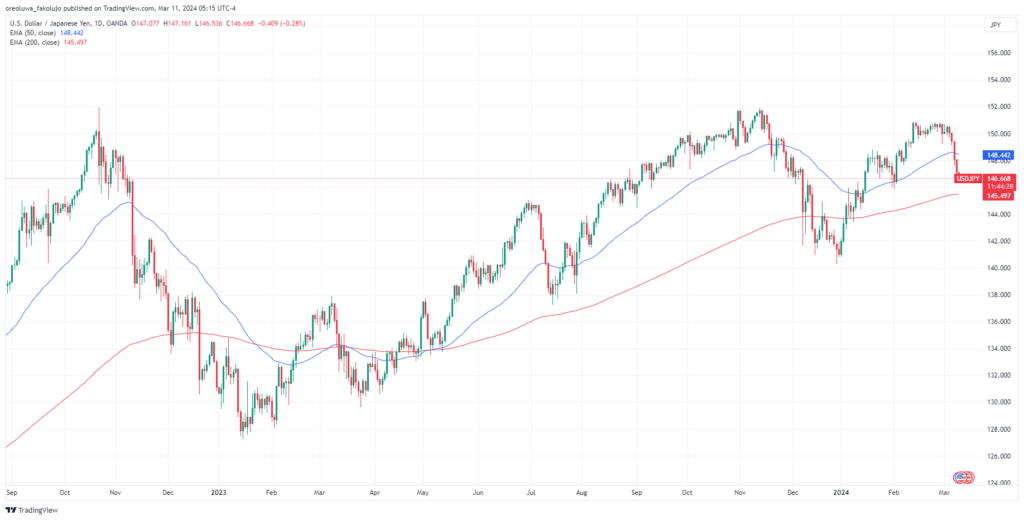
These key economic reports have pushed the USD/JPY into a bearish trend in the short term as the price has dipped below the 50-EMA. The 200-EMA still remains strongly bullish, though. Judging from these, the outlook for the pair is bearish in the short term, although it remains bullish in the long term.
USD/JPY Intraday Technical Analysis – 11/03/2024
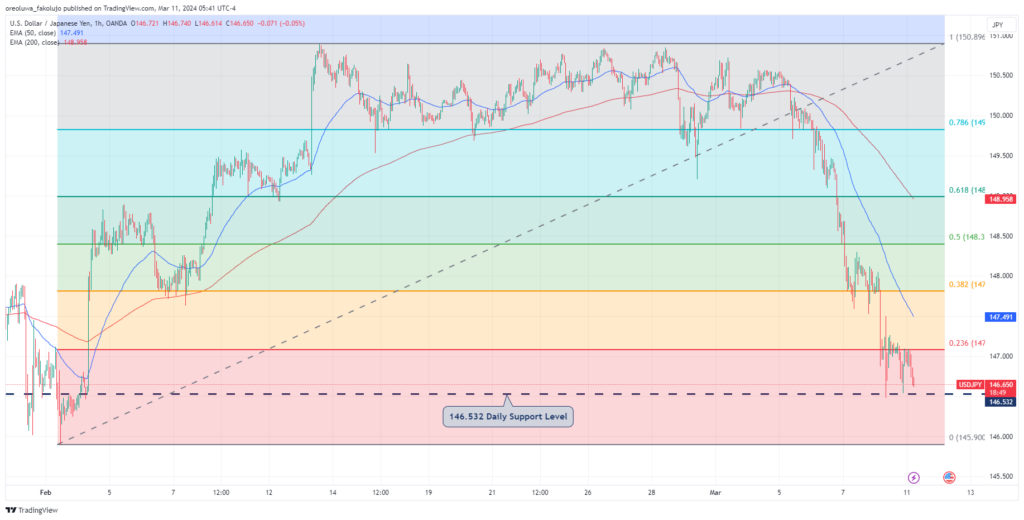
On the hourly chart, the price is on a clear bearish trend, and it currently sits above the daily support level of 146.532. This support level could prove pivotal for this trading day.
Drawing the Fibonacci retracement tool from the major swing low of $145.898 to the $150.888 swing high on the hourly chart, it’s possible that the major bullish trend may be about to end. The price currently stands between the 0 Fib level and the 0.236 Fib level.
This is where the daily support comes in. If the price falls below this support, we may see the price take out the swing low. In recent days, the price has already tested the level twice without successfully breaking it.
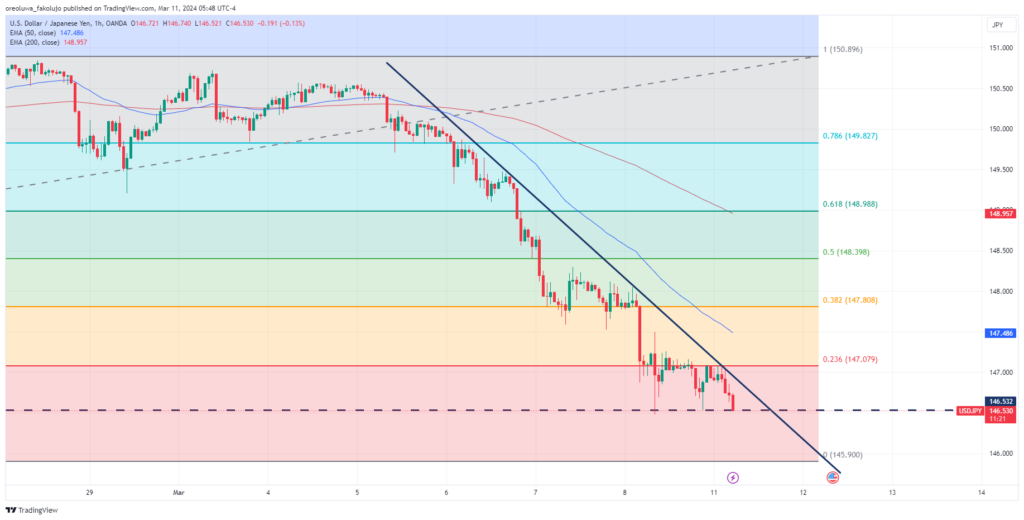
If this support level can hold the price long enough for a bullish push, the first obstruction on the way would be the bearish trendline. If the price breaks this line, the 0.236 Fibonacci level comes into view again. Beyond that, there are many more levels awaiting the price at 0.382 ($147.808), 0.5 ($148.398), 0.618 ($148.988), and 0.786 ($149.827) Fibonacci levels.
Key Economic Data and News to Be Released Today
There’s much to look forward to in terms of Economic data today. From Japan, we expect the BSI large Manufacturing Conditions report for Q1. From the United States, New York Fed 1-year Consumer Inflation Expectations will drop alongside bill auctions. However, investors don’t often look to any of these reports to get insights into interest rate dispositions. What they’ll be more interested in is the U.S. CPI data set to be released tomorrow and US retail sales on Thursday.
USD/JPY Key Fibonacci Price Levels 11/03/2024
Based on the 1hr chart, the key Fibonacci price levels for USD/JPY are:
| Support | Resistance |
| $145.900 | $147.079 |
| $147.808 | |
| $148.398 | |
| $148.988 | |
| $149.827 |
Risk Disclosure: The information provided in this article is not intended to give financial advice, recommend investments, guarantee profits, or shield you from losses. Our content is only for informational purposes and to help you understand the risks and complexity of these markets by providing objective analysis. Before trading, carefully consider your experience, financial goals, and risk tolerance. Trading involves significant potential for financial loss and isn't suitable for everyone.


