The pair remains steady between 1.261 and 1.263 following the release of UK GDP data for Q4. Investors now await the Initial Jobless Claims report to give the pair some direction.
Key Points
- The GBP/USD gained 0.1% yesterday but traded slightly lower in today’s Asian session.
- The price settled into a range within the $1.261 support and $1.263 resistance.
- The UK GDP report was released this morning, which is in line with analysts’ expectations.
GBP/USD Daily Price Analysis – 28/03/2024
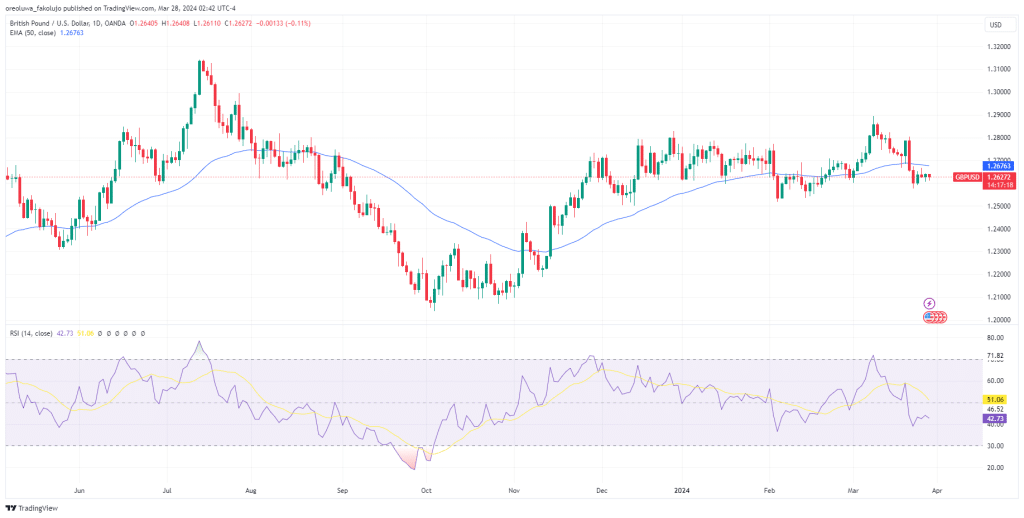
Wednesday was a rather quiet trading day for the GBPUSD, with the pair only recording an overall growth of 0.1%. Already in today’s Asian Session, the price has lost all of that gain, currently trading at $1.26261, a 0.11% drop from its opening price. All in all, the pair is trading inside a range as a result of market indecision.
Fundamentally, Jonathan Hasken, a BoE policymaker, said UK interest rate cuts are still a long way off. Across the Atlantic, Fed Governor Christopher Waller also said something similar about the US economy. According to Waller, there may be a need to sustain the current rate target for a little while longer. Both comments have failed to inspire much movement in the pair.
Investors were waiting for the UK GDP QoQ data, which they expected to contract by 0.3%. The result came in as forecasted.
Technically, the pair’s bearish outlook remains intact since the price broke below the 50-EMA on March 21st. The RSI, after having dropped below the midpoint, also supports this outlook.

GBP/USD Technical Analysis – 28/03/2024
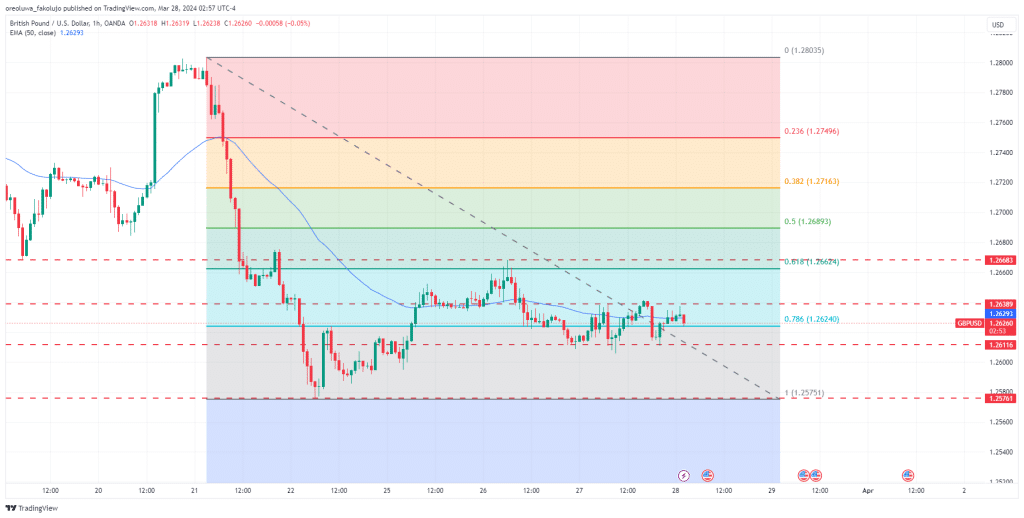
The GBPUSD currently trades between two key levels: the $1.26116 support level and the $1.26389 resistance level. The price is closer to the resistance level but isn’t showing any signs of momentum to break it. If that resistance breaks, we’re looking at another strong resistance level at $1.26683.
On the support side, however, another level, $1.25761, underlies the more immediate support of $1.26116. This support coincides with the monthly low of $1.25752, which was established on March 22nd.
To gain a deeper insight into potential key levels on the price, we plot the Fibonacci retracement tool from the $1.28035 swing high to the $1.25752 swing low. Immediately, we see that those key support and resistance levels ($1.26116 and $1.26389) up there have the 0.786 ($1.26240) Fib level at their midpoint. So far, the price has only succeeded in zig-zagging across the level.
Other key levels to the upside are 0.618 ($1.26624), 0.5 ($1.26893), and 0.382($1.27163). And once again, the lower resistance of $1.25752 remains the only key support level holding the price from a further decline.

Key Economic Data and News to Be Released Today
The QoQ GDP data from the UK was released some minutes ago. Investors were looking at this event to gain some insight into the pair’s price movement for the day. While the economist-forecasted data is -0.3%, anything lower would have hurt the GBP. But the data came out just as forecasted, once again failing to inspire the price to any increase in volatility.
Later today, the Initial Jobless Claims report from the US will be released. If this data shows signs of strength in the US economy, the Fed might be convinced to hold its hawkish stance on interest rates, becoming another headwind for the pair.
GBP/USD Key Fibonacci Price Levels 28/03/2024
Based on the 1hr chart, the key Fibonacci Price levels for the GBPUSD are these:
| Support | Resistance |
| 1.26241 | 1.26625 |
| 1.25752 | 1.26894 |
| 1.27163 | |
| 1.27496 |
Risk Disclosure: The information provided in this article is not intended to give financial advice, recommend investments, guarantee profits, or shield you from losses. Our content is only for informational purposes and to help you understand the risks and complexity of these markets by providing objective analysis. Before trading, carefully consider your experience, financial goals, and risk tolerance. Trading involves significant potential for financial loss and isn't suitable for everyone.


