


The GBP/USD pair is pulling back after the latest lower-than-expected UK inflation report. The price is currently hovering at the critical 1.2470 level, rising from the low of 1.2405 on Tuesday. Yet, the medium to short-term outlook remains bearish.
Key Points
- The British Pound gained slightly on Wednesday following the UK CPI data, ending the three-day losing streak against the Greenback.
- The GBP/USD is trading around the key pivotal level of 1.2470.
- The 1.24771 resistance level will be crucial in today’s trading session.
GBP/USD Daily Price Analysis – 18/04/2024
After three consecutive losing days, the GBP finally gained against the USD on Wednesday. The pair saw a 0.23% increase yesterday and is looking to continue its pullback with another 0.15% increase during the current trading session.
The core CPI report from the UK came in on Wednesday, showing that inflation dropped to 4.2% for the month of March, lower than expected from 4.5% at the same time last year. This, and the progressively rising wage growth in the region, have caused investors to push back expectations for rate cuts until September. Unsurprisingly, the GBP closed on a green candle as a result.
In the US, the Fed has also delayed its rate cut expectations following the last CPI and Retail sales data. However, last week, Fed Chair Powell’s hawkish stance strengthened the USD.
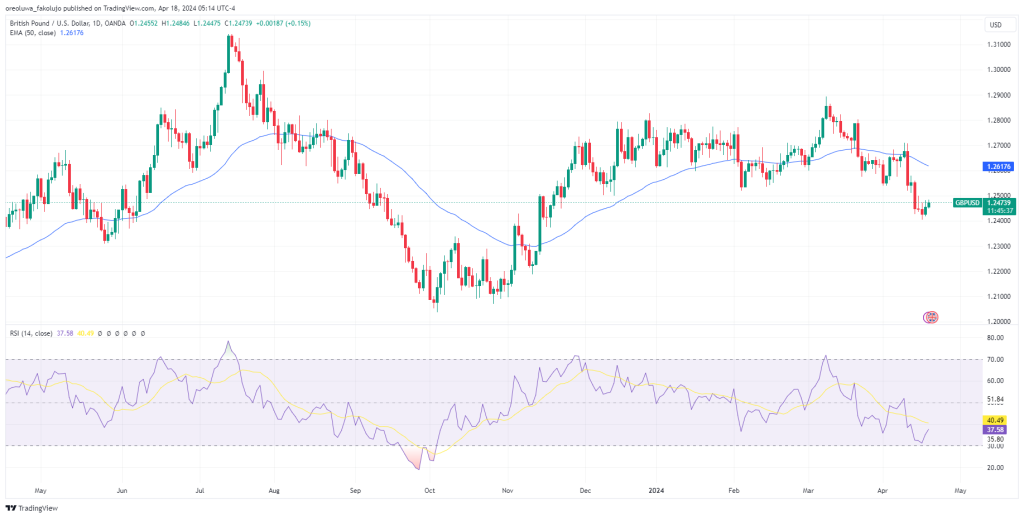
On the technical front, the pair still has a bearish outlook according to the 50 EMA indicator, which hangs far above the price, and the RSI line, which sits on the bearish side of the divide.
GBP/USD Technical Analysis – 18/04/2024
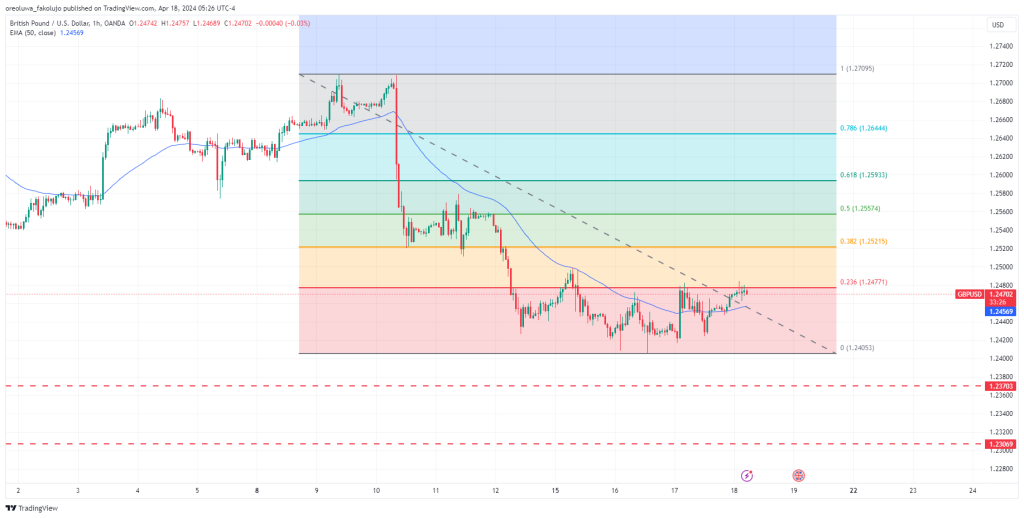
Technically, the pair is at a retracement from the downward drop since April 9th. For the retracement to have any form of credibility, though, it must first break out of the 0.236 (1.24771) Fibonacci retracement level. The price has recently struggled below this level on the hourly chart and looks capped beneath it. If the price successfully breaks past this resistance and also the daily high of 1.24988 from the 15th of April, then we may see the challenge of the higher-up 0.382 (1.25215) fib retracement level. Other Fibonacci resistance levels are 0.5 (1.25574), 0.618 (1.25933), and 0.786(1.26444).
On the flip side, if the price fails to break the 0.236 resistance level and instead falls, the 5-month low of 1.24053 will come under question. If that breaks as well, then we’re looking at 1.23703 and 1.23069 as the next support levels.
Key Economic Data and News to Be Released Today
Today, the US Initial Jobless Claims will be published at 13:30 GMT. The Philadelphia Fed Manufacturing Index and the Existing Home Sales figure will also be taking center stage today.
Finally, FOMC members Bowman, Williams, and Bostic have their testimonies today.
GBP/USD Key Fibonacci Price Levels 18/04/2024
Based on the 1hr chart, the key Fibonacci Price levels for the GBPUSD are these:
| Support | Resistance |
| 1.24053 | 1.24771 |
| 1.25215 | |
| 1.25574 | |
| 1.25933 | |
| 1.26444 |
Related Articles:
Risk Disclosure: The information provided in this article is not intended to give financial advice, recommend investments, guarantee profits, or shield you from losses. Our content is only for informational purposes and to help you understand the risks and complexity of these markets by providing objective analysis. Before trading, carefully consider your experience, financial goals, and risk tolerance. Trading involves significant potential for financial loss and isn't suitable for everyone.


