


The EUR/USD remains calm in today’ seesion as we anticipate the US CPI data, ECB press conference, and core CPI data from Germany, Spain, and France.
Key Points
- The EUR/USD slightly advanced during the European sessions, marking a 0.1% increase.
- The US CPI data is scheduled to be released on Wednesday. On Thursday, investors will be closely monitoring the ECB policy meeting to get rate cut guidance.
- The price currently ranges between the 1.08766 and 1.08441.
EUR/USD Daily Price Analysis: 09/04/2024
Monday ended up being a bullish one for the EURUSD, as the pair climbed by 0.2%. So far in today’s London trading session, the price hasn’t moved much, slightly up by 0.1%.
Generally, the mood remains uncertain among investors as we still await guidance on interest rates from both sides of the pair. The major talking point remains the potential interest rate cut, particularly by the Fed. Investors hope to get clearer rate cut guidance for the EUR on Thursday when the ECB has its policy meeting. So far, inflation has steadily declined in the region, as the ECB posted a lower-than-expected inflation result of 2.4% for March. While the target remains at 2%, the ECB will likely leave the interest rate as it is for now. That said, investors and economists still expect a rate cut in June.
In the US, the economy continues to look solid, as the NFP data from last Friday was stronger than expected. As a result, the June rate cut probability, according to the CME FedWatch Tool, has dropped to 50%. On Wednesday, investors will hope to gain more insight into interest rate direction at the release of the Core CPI data.
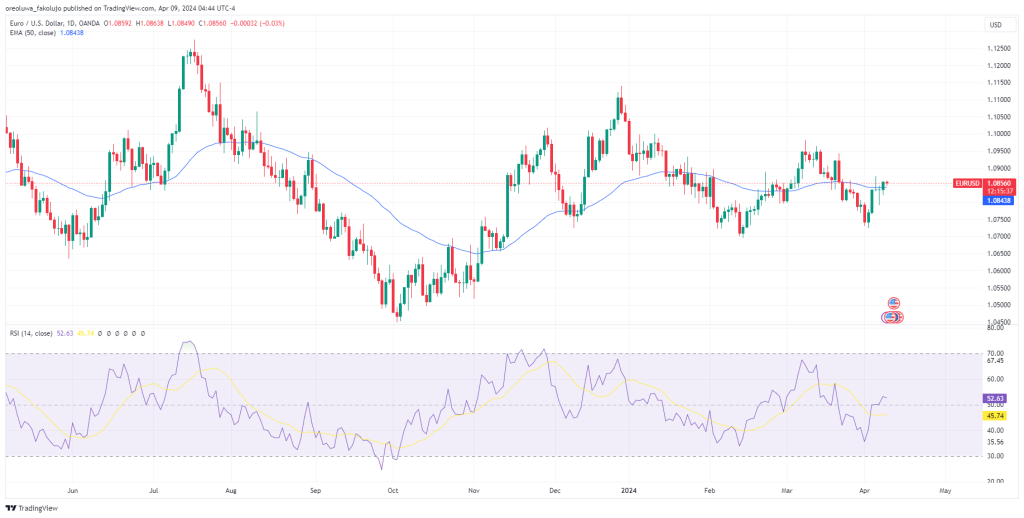
Technically, the pair’s resultant price action movement is sideways, with the price sitting right on the flattening 50 EMA. At the same time, the RSI has remained stuck at the midpoint.
EUR/USD Intraday Price Analysis – 09/04/2024
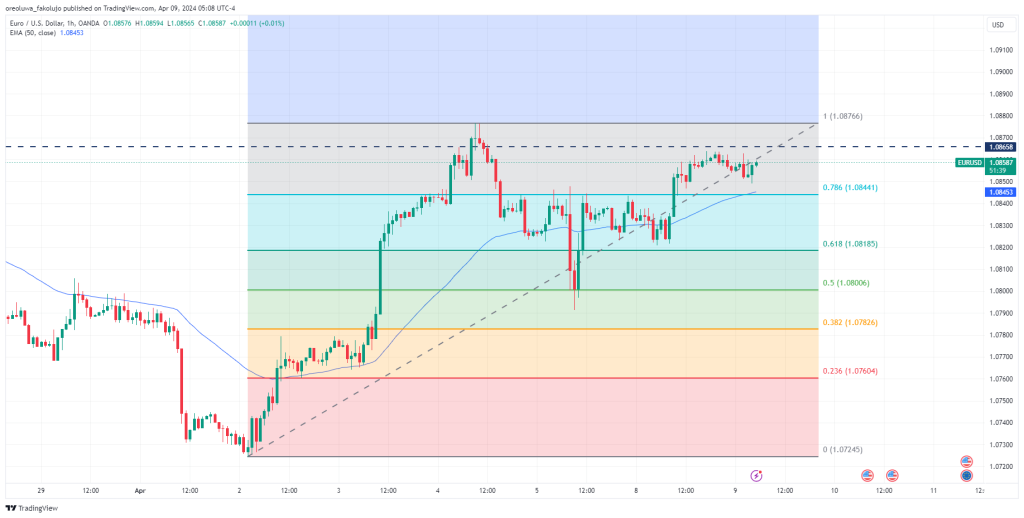
On the hourly chart, the price rose from the swing low of 1.07245 to as high as 1.08766 before finally pulling back. We draw the Fibonacci Retracement tool to measure this retracement and to get potentially tradeable price levels.
After retracing to the 0.5 (1.08006) Fib level, the price resumed its bullish trend and currently hangs between the 0.786 (1.08441) and 1 (1.08766) Fibonacci levels. The momentum looks to have slowed somewhat after yesterday’s rapid break above the 0.786 level. A potential reason for this is that there’s resistance at 1.08658. We will not see the swing high break until the price breaks out of this resistance level.
On the bearish side, the 0,618 (1.08185) Fib level sits right underneath the 0.786 price level. Further below are the 0.5 (1.08006), 0.382 (1.07826), and 0.236 (1.07604) fib levels.
Key Economic Data for the EUR/USD Pair – 09/04/2024
Looking at the rest of the week, investors will focus on the US Core CPI data on Wednesday as far as the Greenback is concerned. For the EUR, there’s the ECB conference on Thursday to look forward to and CPI data from Germany, Spain, and France.
EUR/USD Key Fibonacci Price Levels 09/04/2024
Based on the 1hr chart, the key Fibonacci price levels for EUR/USD are these:
| Support | Resistance |
| 1.08441 | 1.08766 |
| 1.08185 | |
| 1.08006 | |
| 1.07826 | |
| 1.07604 |
Risk Disclosure: The information provided in this article is not intended to give financial advice, recommend investments, guarantee profits, or shield you from losses. Our content is only for informational purposes and to help you understand the risks and complexity of these markets by providing objective analysis. Before trading, carefully consider your experience, financial goals, and risk tolerance. Trading involves significant potential for financial loss and isn't suitable for everyone.


