The EUR/USD is trading steadily in today’s session, as US markets are closed for President’s Day. Wage Data from Europe, the Buba Balz monthly report, and Fed Minutes will be the focus this week.
Key Points
- EUR/USD is unchanged this morning, with low trading volume due to President’s Day in the United States.
- On the daily chart, the pair looks bearish. On the hourly chart, there’s some consolidation going on.
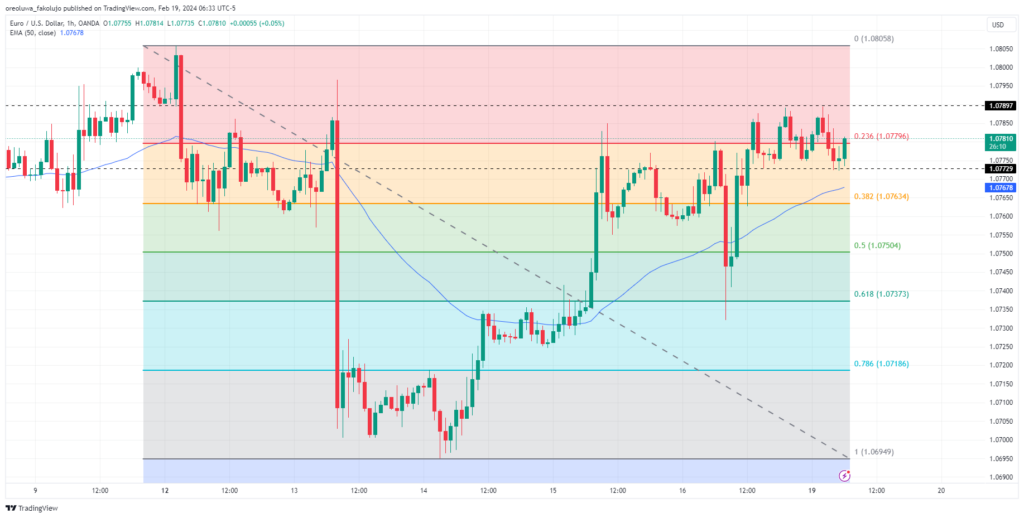
- The current price levels to look out for are $1.07897 and $1.07729, which are the top and bottom of the consolidation, respectively.
EUR/USD Daily Price Analysis: 19/02/2024
Last Friday, EUR/USD rose marginally by 0.04%. The US Producer Price Index (PPI) data was released on Friday, exceeding expectations. While this initially boosted the US Dollar (USD) so that the EUR/USD was priced significantly lower, the USD gains proved short-lived. Everything got completely erased in the New York trading session of that day.
Today, there’s low volume in the market, as it is the Presidents’ Day public holiday in the United States today. The EUR/USD is currently trading at $1.07774, unchanged from Friday as we head into the New York session.
The main focus for the upcoming week will be the Wage Data from Europe, which is expected to be released on Tuesday, and the Fed minutes from the previous month, scheduled on Wednesday.

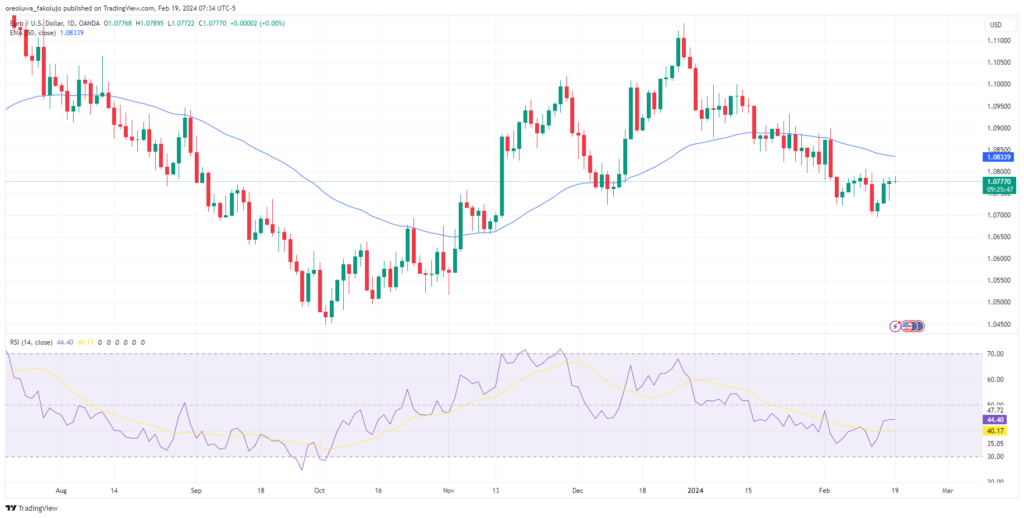
Technically, the price is underneath the 50-EMA, and the RSI line is below the 50-mark, denoting heavy bearishness. As a result of these, the outlook for the pair in the short term remains bearish.
EUR/USD Intraday Price Analysis – 19/02/2024
From the top of the weekly high to the lowest point last week, we mapped out the Fibonacci retracement tool to see how far the price has retraced from its overall bearish trend on the hourly chart. The $1.07800 price level, coinciding with the 0.236 Fibo level, has remained critical for the EUR/USD. The pair has just formed a zig-zag across the price level and seems not to be able to make so much headway from there.
Given this scenario, the two price levels to be on the lookout for are $1.07897 at the top of the consolidation and $1.07729 at the bottom. A break from the top may propel the price to take out the previous weekly swing high of $1.08058 from last week. If this happens, we might witness a change of trend on the daily chart from bearish to bullish.
Yet, if the $1.07729 level gets broken, the price might take out $1.07634, which coincides with the 0.382 Fibonacci level. From there, we may see a further drop to $1.07504 or $1.07373, and maybe even all the way down to continue the overall downtrend of the EUR/USD pair.

Key Economic Data for the EUR/USD Pair – 19/02/2024
It’s Presidents’ Day in the USA today, so we won’t see any significant economic data coming from the US. There are some important updates from Europe, though, as Germany’s Buba Balz monthly report may have an impact on the pair.
EUR/USD Key Fibonacci Price Levels 19/02/2024
Based on the 1hr chart, the key Fibonacci price levels for EUR/USD are these:
| Support | Resistance |
| $1.07634 | $1.07800 |
| $1.07504 | $1.08058 |
| $1.07373 | |
| $1.07186 |
Risk Disclosure: The information provided in this article is not intended to give financial advice, recommend investments, guarantee profits, or shield you from losses. Our content is only for informational purposes and to help you understand the risks and complexity of these markets by providing objective analysis. Before trading, carefully consider your experience, financial goals, and risk tolerance. Trading involves significant potential for financial loss and isn't suitable for everyone.


