


The EUR/USD struggles for direction ahead of the New York session, which brings with it the ISM Manufacturing Services data.
Key Points
- The EUR/USD is trading in a sideways range as we await important news releases from Tuesday to Friday.
- Technically, the price ranges between the $1.08670 resistance level and the $1.07961 support level.
- Investors will be looking for the ISM services data, ECB rate decision, and the NFP for some direction.
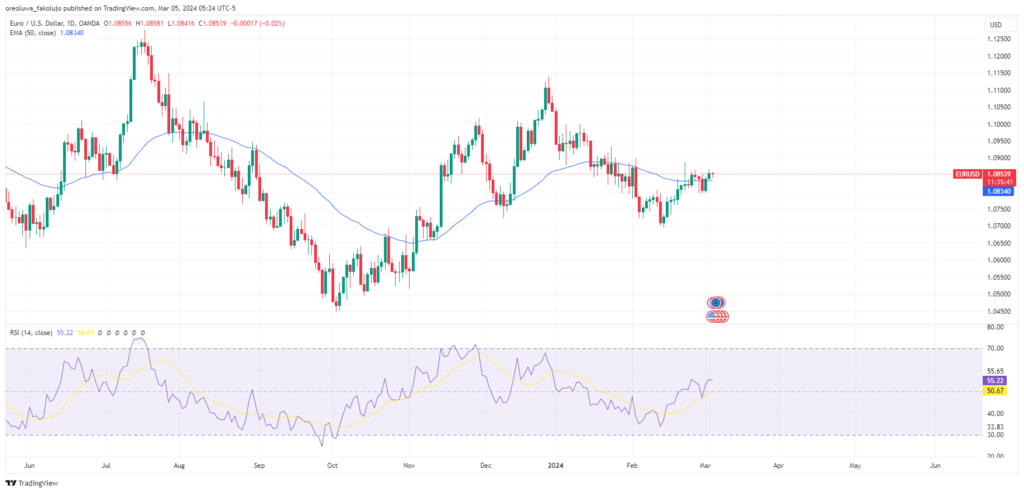
EUR/USD Daily Price Analysis – 05/03/2024
The EURUSD gained 0.15% on Monday but has hardly made any move today. At the time of writing, the pair trades at 1.08534 with only a 0.01% loss.
Investors are cautious about picking a direction for fear of being caught on the losing side of a news-filled week starting today. First off, there’s the ISM Non-Manufacturing PMI data release today. Then tomorrow, we have ADP Nonforam Employment change, JOLTs Job Openings, Crude Oil Inventories, and Fed Chair Powell’s testimony (Wednesday and Thursday). And on Friday, the NFP report goes public.
For the EUR, the ECB Interest Rate Decision on Wednesday is what investors will be paying attention to. The forecast is that the interest rate will remain at 4.5%, but if the data comes out higher than this forecast, the EUR stands to gain.
Investors’ indecision echoes through the technical front as the 50-EMA looks flat and the RSI hovers around the midpoint mark. Considering the above, the short-term outlook for the EUR/USD today is neutral.
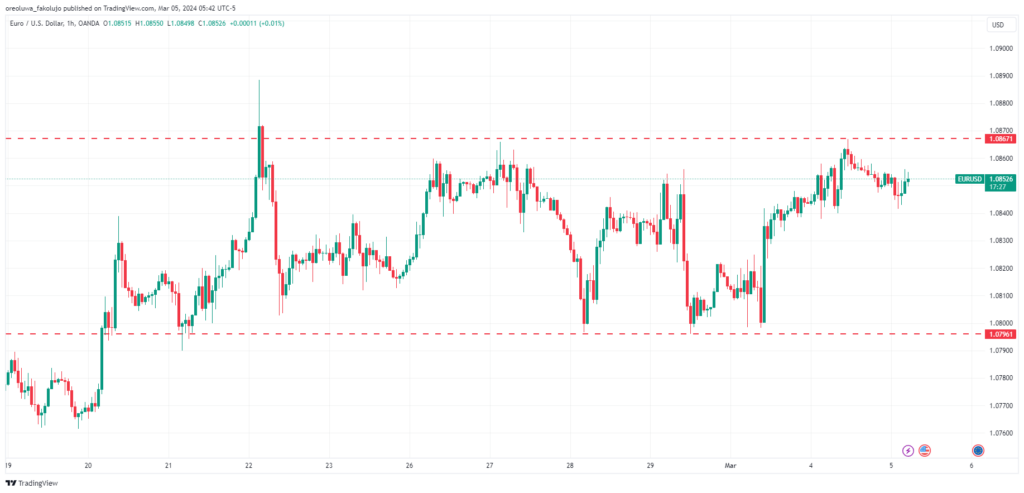
EUR/USD Intraday Price Analysis – 05/03/2024
From the one-hour chart, the consolidation between the $1.08670 resistance level and the $1.07961 support level is apparent. A price breakout from either level will likely bring some upward or downward direction into the chart.
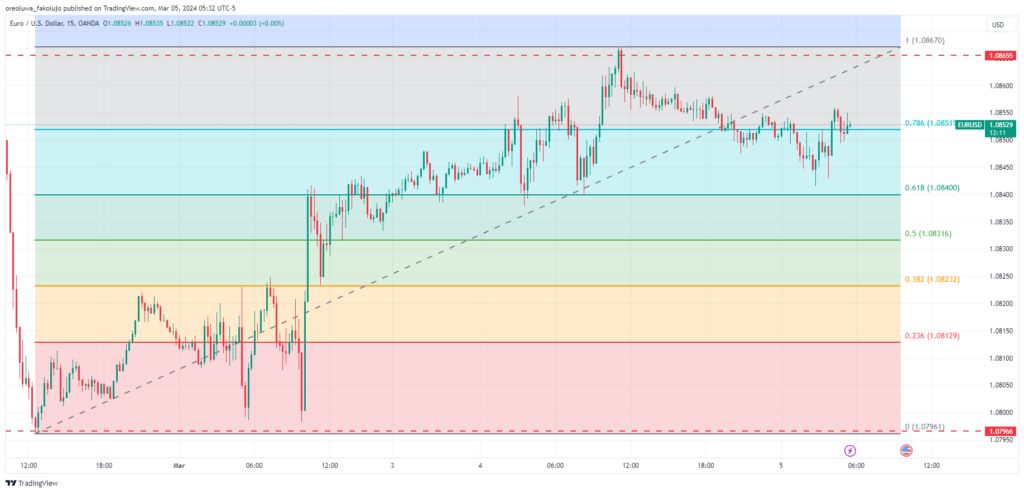
Since the market is in consolidation mode, we need to zoom into the 15-minute timeframe chart to get clearer directions in the short term.
Plotting the Fibonacci retracement tool from the support to the resistance in the 15-minute timeframe, we can see clear key points to watch. The price hovers just above the 0.786 Fibonacci retracement level at $1.08527.
Underneath that 0.786 level is the 0.618 Fibonacci retracement level at $1.08400. And even lower, we have 0.5 ($1.08316), 0.382 ($1.8232), and 0.236 ($1.08129) Fibonacci levels. If the bears take over, these levels will be crucial.
Conversely, the bulls will need to break the 1-hour resistance level of $1.08670, which seems to be the most crucial resistance level.
Key Economic Data for the EUR/USD Pair – 05/03/2024
The ISM Services PMI is the major news release for today at 10:00 AM GMT-5. That, alongside the S&P Global Services PMI, may impact the pair. Forecasts have it that the ISM Services data will be 53.0. When this data comes in stronger than expected, it’s a bullish sign for the Greenback.
Additionally, investors will be watching for the ECB rate decision later this week and the NFP report on Friday.
EUR/USD Key Fibonacci Price Levels – 05/03/2024
Based on the 1hr chart, the key Fibonacci price levels for EUR/USD are these:
| Support | Resistance |
| $1.08519 | $1.08670 |
| $1.08400 | |
| $1.08316 | |
| $1.08232 | |
| $1.08129 |
Risk Disclosure: The information provided in this article is not intended to give financial advice, recommend investments, guarantee profits, or shield you from losses. Our content is only for informational purposes and to help you understand the risks and complexity of these markets by providing objective analysis. Before trading, carefully consider your experience, financial goals, and risk tolerance. Trading involves significant potential for financial loss and isn't suitable for everyone.


