Silver is making giant bullish leaps this morning. The overhanging potential rate-cut atmosphere remains in focus.
Key Points
- Silver has flown up by over 1.58% this morning alone, trading at $22.92, indicating a bullish outlook in the short term.
- A critical resistance level broke for the price to rise as far as it has, so a retracement may be impending.
- On the daily chart, though, things aren’t looking bullish.
Silver Previous Week Recap: 05/02/2024 – 09/02/2024
What a week Silver had last week. First, it fell by 2.21% from Monday through Wednesday amid rising treasury yields and a strong US dollar. The U.S. 10-year Treasury yield had risen to 4.17%, the highest in a couple of months. As a result, safe-haven, non-yielding investments like Silver and Gold took a hit. Then, on Thursday, silver gained 1.67% before uncertainty engulfed the market on Friday, creating a Doji candle pattern on the silver daily chart.
Silver Daily Price Analysis – 12/02/2024
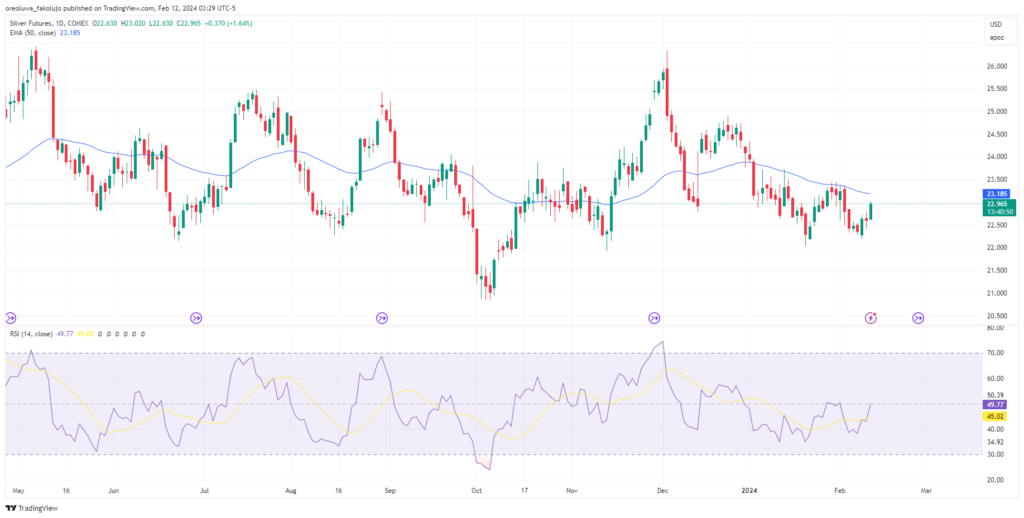
It’s a new week, and as we speak, Silver has gained over 1% so far today. Yet, technically, the overall daily trend still remains bearish, with the 50 EMA above the price and the RSI under the 50 mark, suggesting a bearish outlook.

Despite the bearish outlook, the XAG/USD price will be heavily influenced by the CPI report tomorrow. If this report bears signs of slowing inflation, this would make rate cuts more likely.
Silver Intraday Technical Analysis – 12/02/2024
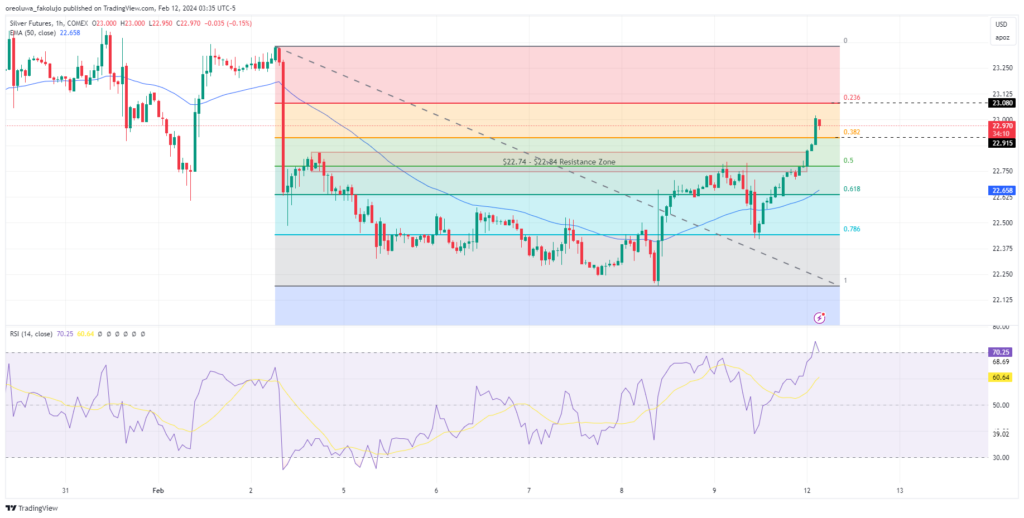
So far today, the sentiment is positive for the precious metal today, having formed a clear bullish structure. It is also clear that the resistance level that was conveniently set up at the $22.74 – $22.84 zone has been broken, giving us a strong indication of a bullish charge.
On the 1H chart, the price is way above the 50 EMA, and the RSI is so high that it has hedged into the overbought zone. That’s a potential headwind in front of the metal today. If the prophecies of the RSI are anything to go by, prices reverse when the indicator enters the overbought and oversold zones. This means a resistance is impending on the indicator at some point. Moreover, the 0.382 Fibonacci level at $22.92 may do the job. If that fails, there’s another level to be tested at 0.236 level at $23.08.
On the bearish side, the price could fall below $22.42 before a bullish bias is confirmed.

Key Economic Data and News to be Released Today
US Fed officials are expected to speak later today. Investors will also wait for the CPI reports tomorrow for more clues regarding the Fed’s rate cut policy.
Silver Key Fibonacci Price Levels 12/02/2024
Based on the 1hr chart, the key Fibonacci price levels for Silver are these:
| Support | Resistance |
| 22.91 | 23.08 |
| 22.77 | 23.35 |
| 22.64 |
Risk Disclosure: The information provided in this article is not intended to give financial advice, recommend investments, guarantee profits, or shield you from losses. Our content is only for informational purposes and to help you understand the risks and complexity of these markets by providing objective analysis. Before trading, carefully consider your experience, financial goals, and risk tolerance. Trading involves significant potential for financial loss and isn't suitable for everyone.


