


Today’s trading saw natural gas prices continuing their upward trajectory, opening at $2.050 and currently standing at $2.072, influenced by a rebound in feedgas supplies at Freeport LNG.
Key Points
- Natural gas prices increased by 5.56% yesterday due to warmer weather forecasts increasing demand.
- Continued upward price movement today, influenced by improved supply conditions at Freeport LNG.
- Restart of a liquefaction train at Freeport LNG boosted demand expectations.
Natural Gas Daily Price Analysis – 30/04/2024
Natural gas prices saw a robust increase yesterday, with the closing price at $2.030 per MMBtu, up from an opening of $1.923, marking a significant daily gain of 5.56%. The uplift was primarily driven by forecasts of warmer weather, which spurred expectations of increased demand for cooling as air conditioning usage rises. This trend was further supported by a boost in demand from electricity providers.
Continuing the upward momentum, today’s trading session began at $2.050 and natural gas has currently advanced to $2.072, up 2.07%. The surge is partly attributed to a recovery in feedgas supplies to Freeport LNG’s Texas export plant, which reached a three-week high yesterday.
The restart of one of the liquefaction trains at Freeport LNG after recent outages has provided a positive stimulus, as highlighted by the increase in feedgas levels. This development aligns with forecasts of warmer temperatures extending till May 11, promising sustained demand for natural gas.
However, the global natural gas market is also seeing some easing on the supply side as operations normalize at key U.S. liquefied natural gas facilities, which might temper price gains slightly. Additionally, meteorological predictions indicate a return to near-normal temperatures from May 12-14, which could reduce cooling-related gas consumption slightly.
Key Economic Data and News to Be Released Today
On the US Dollar front, high impact economic data set to be released today includes the consumer confidence and employment cost index data. Positive data might strengthen the dollar, making dollar-priced commodities more expensive in other currencies and potentially reducing international demand. Conversely, weaker-than-expected figures could lead to a weaker dollar, potentially increasing demand for commodities.
Likewise, the energy market will be keenly watching for any significant changes in weather forecasts or disruptions in LNG export operations, which could sway prices further. As we approach the warmer months, fluctuations in temperature will play a critical role in shaping demand for natural gas.
Natural Gas Technical Analysis – 30/04/2024
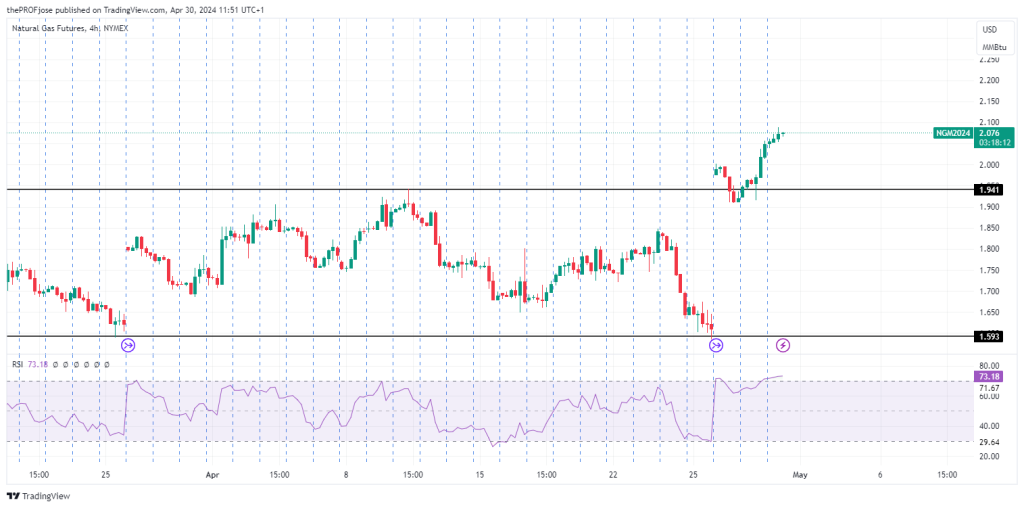
On the four-hour chart, natural gas prices have broken out from the previous consolidation range of $1.593 to $1.941, indicating a strong bullish trend.
Looking at the 15-minute chart, the price also demonstrates significant bullish momentum, trading above the 200 EMA. However, the Relative Strength Index (RSI) indicator points to potential overbought conditions, suggesting a likely short-term pullback.
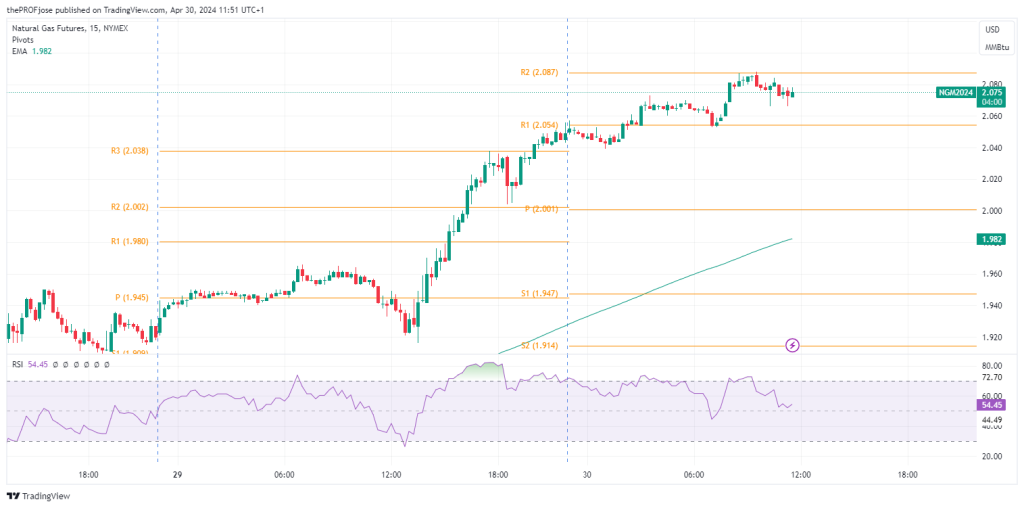
Should the price close above the $2.087 mark, it would confirm the continuation of the bullish trend, aligning with the signals from higher timeframes.
Natural Gas Fibonacci Key Price Levels 30/04/2024
Short-term traders planning to trade NG today should keep a close eye on the following key price levels for the day:
| Support | Resistance |
| 1.947 | 2.087 |
| 1.914 | 2.141 |
| 1.861 | 2.255 |
Related Articles:
Risk Disclosure: The information provided in this article is not intended to give financial advice, recommend investments, guarantee profits, or shield you from losses. Our content is only for informational purposes and to help you understand the risks and complexity of these markets by providing objective analysis. Before trading, carefully consider your experience, financial goals, and risk tolerance. Trading involves significant potential for financial loss and isn't suitable for everyone.


