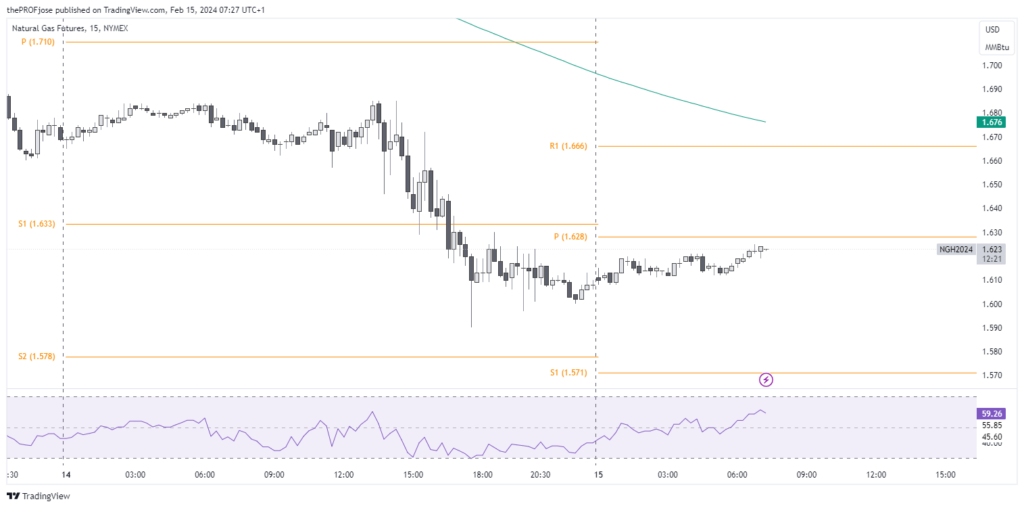
While the natural gas market is showing signs of a slight recovery today, the backdrop of seven consecutive red days and the anticipation of critical reports cast a shadow over the immediate outlook.
Key Points
- Natural gas prices experienced seven consecutive days of decline.
- Mild recovery was observed in today’s session amidst bearish momentum.
- According to a recent IEA report, it is anticipated that the natural gas sector will experience a resurgence in 2024.
Natural Gas Daily Price Analysis – 15/02/2024
According to the International Energy Agency (IEA), the natural gas markets are expected to experience growth in 2024, mainly driven by the industrial and power sectors in rapidly developing economies across Asia, Africa, and the Middle East. The anticipated return to average winter weather conditions, following a mild year in 2023, is projected to elevate the demand for space heating in the Northern Hemisphere. However, this might be balanced by expanding renewable energy sources and improving nuclear energy availability, which could dampen the need for gas-fired power generation, especially in established markets.
Following these developments, the Natural Gas market has exhibited volatility recently, with significant price movements both yesterday and today. Yesterday, the market witnessed a downward trend, which resulted in prices reaching a low of 1.590 USD/MMBtu. However, as of the time this writing was written, the market saw a slight recovery, with prices oscillating around key levels.
As the day opened, NG price fluctuated within a range, hitting a high of 1.639 USD/MMBtu and a low of 1.611 USD/MMBtu in the early hours. Throughout the trading day, the prices continued to show some resilience, with the latest reported value at 1.637 USD/MMBtu, a 1.74% increase from the real-time data reported at this writing.
Looking forward, the trading day is expected to close with Natural Gas prices remaining sensitive to macroeconomic indicators and potential shifts in market sentiment.
Key Economic Data and News to Be Released Today
While no significant direct economic events are scheduled for today impacting Natural Gas, traders should consider broader economic indicators like GDP growth rates and interest rates that could indirectly influence energy prices.
Natural Gas Technical Analysis – 15/02/2024
The technical outlook on Natural Gas shows the asset to be currently in a downtrend. Following seven consecutive days of decline in NG prices, the current uptick might be short-lived, with prices trending under the 200 EMA and struggling to stay above the pivot point convincingly.

Also, while taking a look at the RSI indicator, it’s clear that NG is getting close to being overbought, and we can anticipate a sell-off at the R1 key level. But, should the price break and close above this level, we may keep a close eye on its reaction to the 200 EMA before having a bullish outlook on the asset.
Natural Gas Fibonacci Key Price Levels 15/02/2024
Short-term traders planning to invest in NG today should keep a close eye on the following key price levels for the day:
| Support | Resistance |
| 1.628 | 1.675 |
| 1.646 | 1.682 |
| 1.657 | 1.700 |
Risk Disclosure: The information provided in this article is not intended to give financial advice, recommend investments, guarantee profits, or shield you from losses. Our content is only for informational purposes and to help you understand the risks and complexity of these markets by providing objective analysis. Before trading, carefully consider your experience, financial goals, and risk tolerance. Trading involves significant potential for financial loss and isn't suitable for everyone.


