As investors anticipate high-impact economic data releases, natural gas seems to lose its bullish steam today.
Key Points
- Price surged yesterday as traders reacting to the EIA report
- Natural Gas prices are heading down following the Empire State Manufacturing Index data release.
- Short-term traders’ eyes are on price reaction to fresh key levels.
Natural Gas Daily Price Analysis – 15/03/2024
Yesterday’s notable increase of 5.01% in natural gas prices can be attributed to a report from the Energy Information Administration (EIA) that revealed a larger-than-expected decrease in natural gas storage.
The report indicated a decrease of 9 billion cubic feet (Bcf) for the week, surpassing analyst expectations of a 3 Bcf draw. This draw is significantly smaller than the five-year average for this period, which is a reduction of 87 Bcf. Despite this, the current storage levels are 336 Bcf higher than the same time last year and 629 Bcf above the five-year average, suggesting that storage levels remain high overall.
The larger-than-expected draw in storage is seen as a bullish sign, potentially indicating tighter supply conditions than anticipated. Additionally, forecasts of colder weather in the upcoming week may further support the market by increasing demand for heating, thus potentially prolonging the upward pressure on prices.
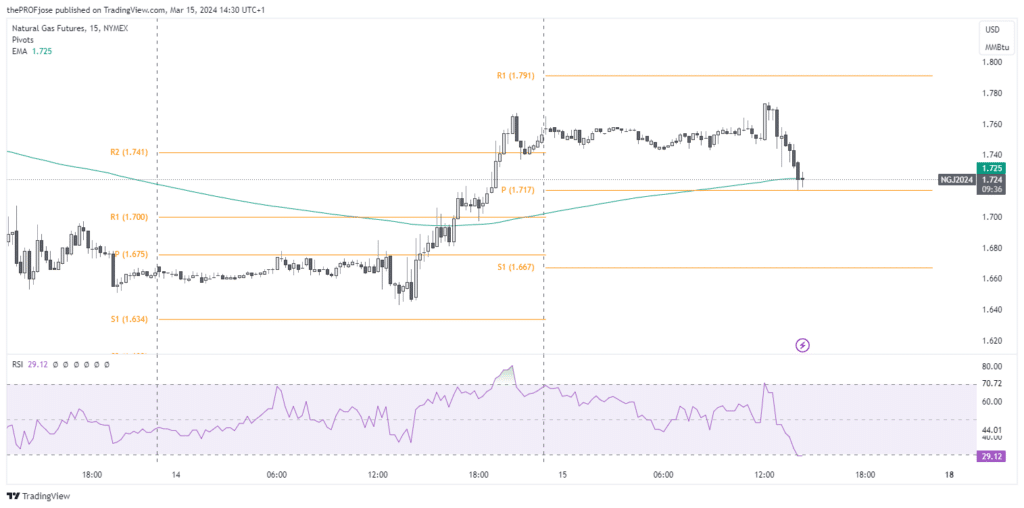
Earlier today, Natural Gas showed a slight continuation of yesterday’s momentum, reaching a modest increase of +0.46% in its price. However, it has dropped significantly to a whopping -0.86% from its daily high of 1.774 following the ESM Index data release. All in all, the short-term outlook seems to be mixed, although the medium to long-term sentiment remains bearish.
Key Economic Data and News to Be Released Today
A worse-than-expected figure in the Empire State Manufacturing Index data release had signalled a slowing manufacturing activity, reducing demand for natural gas in industrial sectors. This can potenitally push prices lower, despite the EIA report data that was released yesterday.
However, the upcoming Preliminary UoM Consumer Sentiment Index, another key indicator, reflects consumer confidence and spending ability, indirectly affecting energy consumption. An uptick in consumer sentiment could signal increased future consumption, potentially bolstering demand for natural gas as a source of energy.
Natural Gas Technical Analysis – 15/03/2024
Looking at NG’s price from a technical perspective, we might expect a bullish recovery after this intraday price dip.

The price is currently testing the intraday 200 Exponential Moving Average and the pivot point simultaneously, while the RSI suggests that the Natural Gas price is oversold and ready to reverse. However, a close below the pivot point may change the narrative.
Short-term traders should wait for price to react to the upcoming economic data release before jumping into a position.
Natural Gas Fibonacci Key Price Levels 15/03/2024
Short-term traders planning to trade NG today should keep a close eye on the following key price levels for the day:
| Support | Resistance |
| 1.716 | 1.751 |
| 1.726 | 1.756 |
| 1.731 | 1.766 |
Risk Disclosure: The information provided in this article is not intended to give financial advice, recommend investments, guarantee profits, or shield you from losses. Our content is only for informational purposes and to help you understand the risks and complexity of these markets by providing objective analysis. Before trading, carefully consider your experience, financial goals, and risk tolerance. Trading involves significant potential for financial loss and isn't suitable for everyone.


