


Natural gas May futures dropped -3.58% on Wednesday, following a drop of -2.48% yesterday. Technical analysis reveals a strong bearish signal for natural gas as it trends below 200 EMA.
Key Points
- Natural gas prices dipped further, down 2.48% yesterday amid weakening demand signals.
- Today, natural gas volatility spikes and drops by 3.58%, which is influenced by European market dynamics.
- FOMC Member Waller’s upcoming speech is eyed for potential impact on natural gas prices.
Natural Gas Daily Price Analysis – 27/03/2024
Yesterday, Natural Gas experienced a downturn, closing at $1.575, marking a decline of 2.48% from the open price of $1.608. This move towards a lower price was influenced by a combination of factors driving negative momentum, particularly major indicators hinting at a weakening global demand. The day saw the asset test the waters near the $1.605 level, approaching the historical support mark at $1.540, reflecting the broader negative tendencies affecting the commodity.
Today, the asset showed a more volatile pattern, with an opening price of $1.784 but then retracting to a current price of $1.724, which represents a change of -3.58%. This volatility is partially attributed to the dynamics within European gas markets, which have seemingly exerted downward pressure on US gas prices, pulling them back to flat levels after initial gains earlier in the day. All in all, the short-term outlook for NG is bearish.
Key Economic Data and News to Be Released Today
Today’s trading day holds significant potential for price movement due to scheduled economic events. Notably, a speech by FOMC Member Waller later tonight is highly anticipated. Given the influence of Federal Reserve policies on the USD, any hints or indications of future monetary policy can have a direct impact on commodities prices, including Natural Gas.
Moreover, the current trading environment for Natural Gas is significantly shaped by the broader economic indicators and market sentiments. For instance, recent data on durable goods orders and consumer confidence could provide insights into the overall economic health and demand prospects for energy commodities. As these economic indicators suggest shifts in consumer and business activities, they invariably influence the demand for Natural Gas, especially considering its wide usage across various sectors.
Natural Gas Technical Analysis – 27/03/2024
Today, NG’s price action shows the commodity consistently breaking through key support levels, showing a strong bearish signal. Similarly, Natural Gas is currently trending below the intraday 200 EMA, showing that the trend has switched bearish.
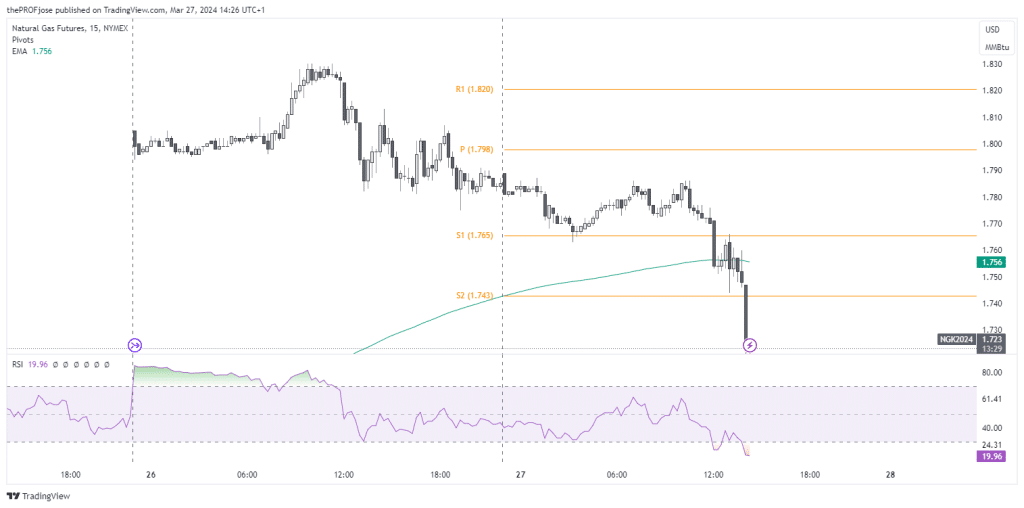
Although the Relative Strength Index (RSI) indicator currently suggests the asset to be oversold, we might see a little retracement to a recent resistance level before price continues its downward movement.
Natural Gas Fibonacci Key Price Levels 27/03/2024
Short-term traders planning to invest in NG today should keep a close eye on the following key price levels for the day:
| Support | Resistance |
| 1.743 | 1.768 |
| 1.750 | 1.772 |
| 1.754 | 1.779 |
Risk Disclosure: The information provided in this article is not intended to give financial advice, recommend investments, guarantee profits, or shield you from losses. Our content is only for informational purposes and to help you understand the risks and complexity of these markets by providing objective analysis. Before trading, carefully consider your experience, financial goals, and risk tolerance. Trading involves significant potential for financial loss and isn't suitable for everyone.


