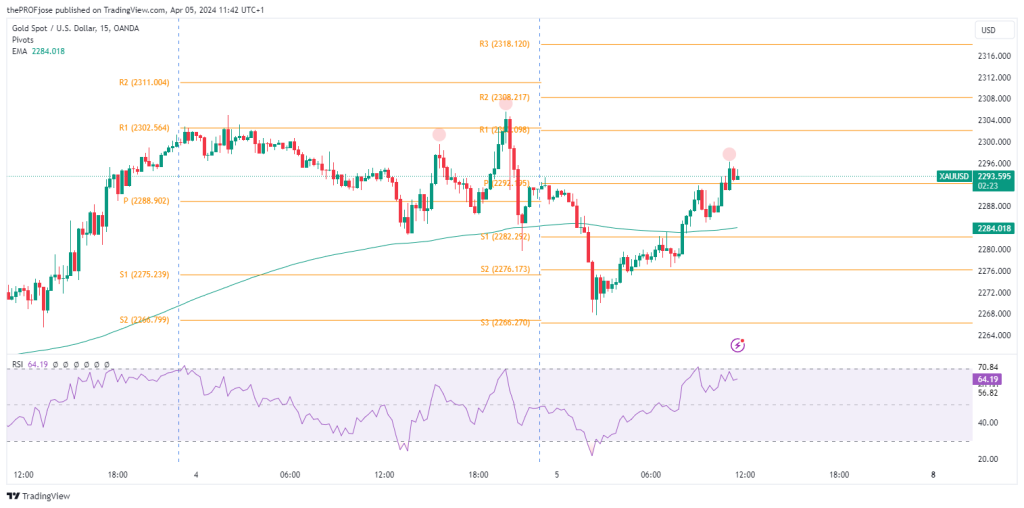
A confluence of factors previously drove gold to new highs. However, Gold slightly retreated from its record high in today’s morning session ahead of key U.S. non-farm payroll data that could influence the Federal Reserve’s rate decisions.
Key Points
- Factors like the U.S. dollar’s decline and geopolitical tensions pushed gold to record highs.
- Technical signals warn of a short-term gold pullback, with overbought conditions and a bearish pattern.
- The U.S. March NFP data release is keenly awaited for its potential effects on gold’s future pricing.
Gold Daily Price Analysis – 05/04/2024
On the previous trading day, gold closed at $2,289.43 per ounce, marking a slight decrease of 0.42% from its opening price of $2,299.62. This downward movement was preceded by a record-breaking session on Thursday, where spot gold reached an all-time high of $2,305.04 per ounce. However, as of the early hours of today, gold has shown resilience, with its price adjusting to $2,295.22, reflecting a modest increase of 0.18% from the opening price of $2,288.97. This rebound suggests a cautious optimism among investors, possibly in anticipation of the NFP data release and its implications for the Fed’s monetary policy.
The recent performance of gold prices can largely be attributed to a confluence of factors. Among these, the anticipation surrounding the U.S. non-farm payrolls (NFP) data stands out as a critical driver. This key economic indicator, due for release later today, is poised to offer further insights into the Federal Reserve’s potential monetary policy adjustments. The speculation and resultant market sentiment ahead of the release have caused some volatility in gold prices as investors and traders align their positions with expected outcomes.
Gold’s slight retreat from its record surge, much like Silver’s bullish rally pause, can be seen as a natural market correction influenced by shifts in the U.S. dollar’s strength, investor expectations regarding the Federal Reserve’s rate decisions, economic uncertainties, and geopolitical tensions, particularly in the Middle East. These factors have collectively contributed to the metal’s appeal as a safe-haven asset, driving its prices to new highs before the recent pullback.
Key Economic Data and News to Be Released Today
The focus is squarely on the release of the U.S. March NFP data at 12:30 GMT. Analysts and traders alike are keenly awaiting this data, as it could provide pivotal clues regarding inflationary pressures and, by extension, the timing of the Federal Reserve’s anticipated rate cuts.
A stronger-than-expected NFP report could exert downward pressure on gold prices by highlighting rising inflationary trends, potentially accelerating discussions around rate hikes. Conversely, weaker employment growth could bolster gold’s appeal, as it might signal economic softening, prompting the Fed to adopt a more dovish stance sooner than expected.
Gold Technical Analysis – 05/04/2024
Despite the overall bullish trend that has characterized gold’s market performance recently, current technical patterns and indicators suggest a potential short-term bearish reversal.

Firstly, the Relative Strength Index indicator indicates that gold is currently in the overbought territory. Moreover, the formation of a bearish Head and Shoulders pattern on the gold price charts adds a technical foundation to the anticipations of a downward correction.
The expected bearish pullback would likely lead gold prices toward significant support levels. These key levels will be crucial for traders to watch. A successful bounce off these support levels could confirm the strength of the overall bullish trend and potentially offer opportunities for re-entry into long positions for those looking to capitalize on gold’s fundamental strengths.
Gold Fibonacci Key Price Levels 05/04/2024
Short-term traders planning to trade gold today should keep a close eye on the following key price levels for the day:
| Support | Resistance |
| 2282.292 | 2302.098 |
| 2276.173 | 2308.217 |
| 2266.270 | 2318.120 |
Risk Disclosure: The information provided in this article is not intended to give financial advice, recommend investments, guarantee profits, or shield you from losses. Our content is only for informational purposes and to help you understand the risks and complexity of these markets by providing objective analysis. Before trading, carefully consider your experience, financial goals, and risk tolerance. Trading involves significant potential for financial loss and isn't suitable for everyone.


