Gold prices continue to trade at critical levels, currently hovering around $2030, with investors’ attention shifting to the Fed’s rate-cut policy.
Key Points
- Gold prices consolidate on Wednesday morning as investors await more cure on the Fed’s rate cut decision.
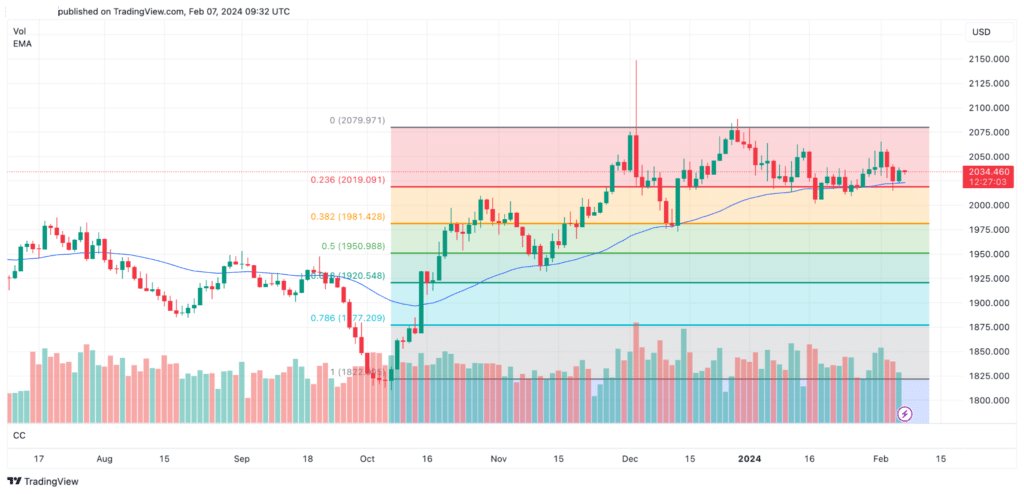
- Technically, the yellow metal trades above the 50 EMA line, which signals a maintained bullish momentum.
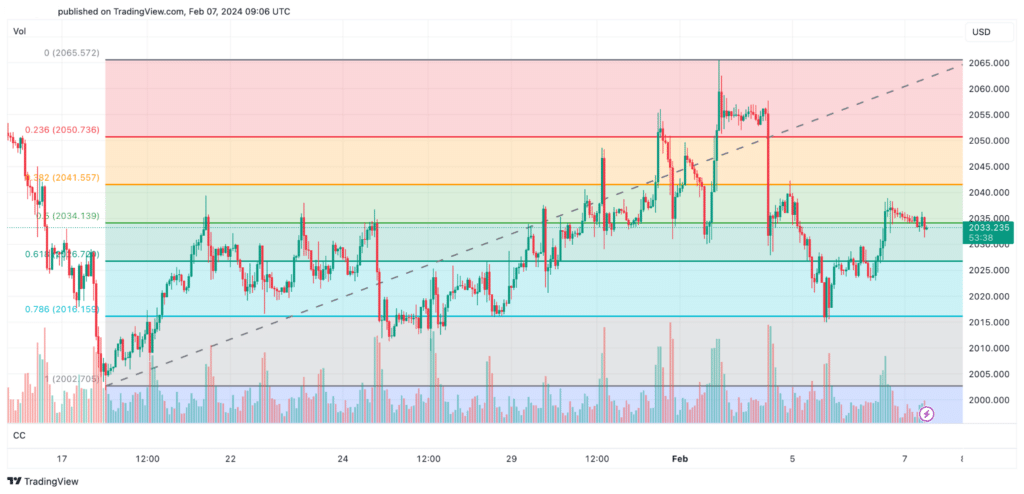
- A break above $2041.55 can push gold prices higher, while a break below $2026.72 can indicate a shift in gold market sentiment.
Gold Daily Price Analysis – 07/02/2024
Gold trades in consolidation mode in the early Wednesday session after a positive day on Tuesday, gaining 0.54%. The Yellow Metal continues to look for bullish momentum amid a weak dollar and reduced rate cut expectations. After testing the critical support level of $2015 on Monday, Gold prices pushed higher to test Monday’s daily high of $2041.
At the time of writing, gold trades at $2035, signaling a moderately bullish momentum for XAU/USD in the near term. Fundamentally, the outlook remains unclear for the yellow metal following robust US economic data and hawkish comments from the Fed officials. Meanwhile, an increase for a rate-cut probability in March to 21.5%, according to the FedWatch Tool, leaves gold traders without any clear indication of the next market move.
Gold Technical Analysis – 07/02/2024
Amid a lack of key data to watch in the upcoming days, investors will closely watch for technical indicators to determine gold’s next direction. On the daily chart, gold price currently trades above the 50 EMA line, slightly higher than the crucial support level of $2030. Technically, this can be interpreted as a potentially bullish setup, although a break above the next target of $2041.55 can validate the short-term uptrend.

Looking at the 1H chart technicals, $2041.55 would be the next target based on Fib levels or yesterday’s high of $2039.
On the downside, a break below $2026.72 will signify a weakness of the bullish momentum. The next price levels for sellers to keep an eye on could be $2019.1, $2016.15, and $2002.7.
H2: Key Economic Data and News to Be Released Today
The economic calendar has no high-impact US data to be released today. Traders will, therefore, focus on Fed officials’ speeches today, and the US Initial Jobless Claims, as well as the 30-year bond auction tomorrow.
Gold Fibonacci Key Price Levels 07/02/2024
Based on the 1-Hour chart, here are the key gold Fibonacci support and resistance levels to watch as of 07/02/2024.

| Support | Resistance |
| 2034.13 | 2041.55 |
| 2026.72 | 2050.83 |
| 2016.15 | 2065.57 |
| 2002.7 |
Risk Disclosure: The information provided in this article is not intended to give financial advice, recommend investments, guarantee profits, or shield you from losses. Our content is only for informational purposes and to help you understand the risks and complexity of these markets by providing objective analysis. Before trading, carefully consider your experience, financial goals, and risk tolerance. Trading involves significant potential for financial loss and isn't suitable for everyone.


